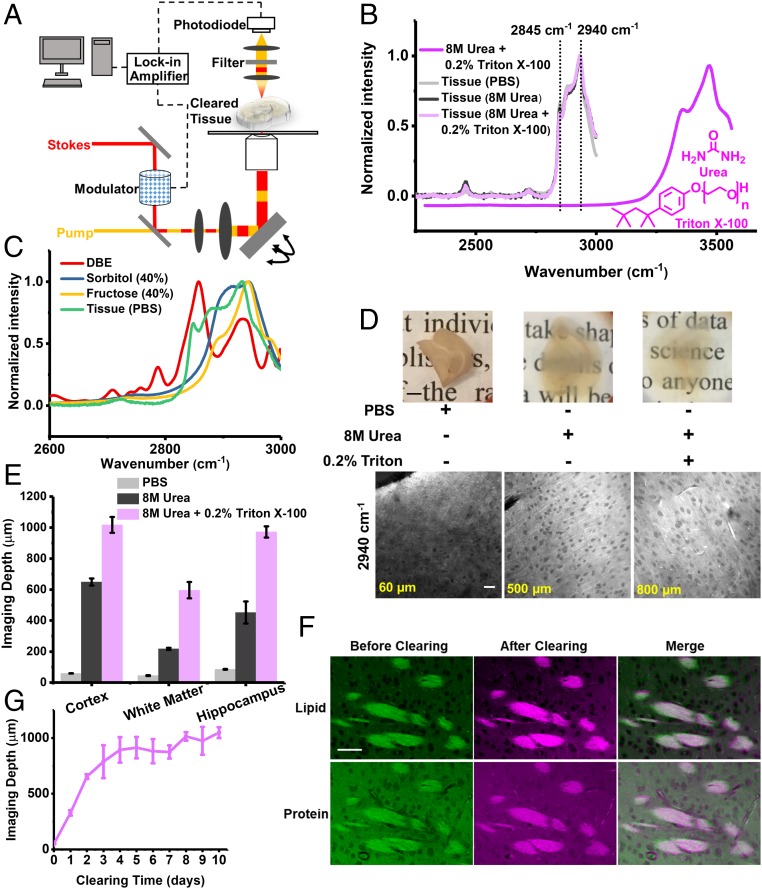
Fig. 1.
Development of clearing-enhanced SRS microscopy. (A) Set-up for clearing-enhanced SRS microscopy. (B) Spontaneous Raman spectra of 8 M urea and 0.2% Triton X-100 (dark magenta), mouse brain slices in PBS (light gray), slices cleared with 8 M urea (dark gray), and slices cleared with 8 M urea solution with 0.2% Triton X-100 (light magenta). (C) Spontaneous Raman spectra of dibenzyl ether (red), 40% sorbitol solution (blue), 40% fructose solution (yellow), and mouse brain slices in PBS (green, the same as B). (D) Photos and the corresponding SRS images (2,940 cm−1) close to depth limit (60, 500, and 800 µm) of 1-mm-thick brain slices in PBS, cleared with 8 M urea, and with 8 M urea and 0.2% Triton X-100, respectively. [Scale bars: 2 mm in the photos (Upper), 50 µm in the SRS images (Lower).] (E) Quantification of label-free imaging depths for different brain regions in PBS, cleared with 8 M urea, and cleared with 8 M urea and 0.2% Triton X-100. Error bars indicate SEM (n = 4, 6, and 4 for cortex, white matter, and hippocampus in PBS. n = 4, 3, and 3 for cortex, white matter, and hippocampus in 8 M urea. n = 3 for each brain region in 8 M urea and 0.2% Triton X-100). The imaging depth limit was defined as the depth with signal-to-background ratio of 0.5. (F) SRS images of regions in the same white matter region before and after tissue clearing (8 M urea with 0.2% Triton X-100). (Scale bars, 50 µm.) (G) Quantification of imaging depth with clearing time (8 M urea with 0.2% Triton X-100). Error bars indicate SD (n = 3 for each data point).

