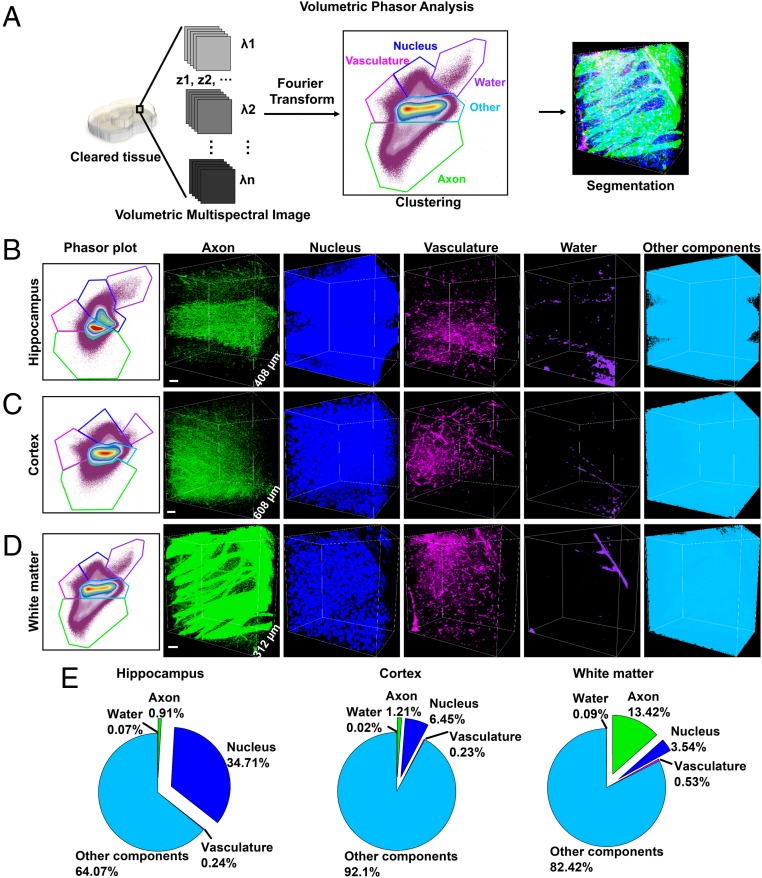
Fig. 4.
Volumetric phasor analysis. (A) Schematic process of volumetric phasor analysis. Volumetric phasor analysis provides segmentation of various regions in mouse brains: the hippocampus (B), the cerebral cortex (C), and the white matter (D). For B–D, the phasor plot is shown (Left) and followed by volumetric images of segmented species. “Other components” include extracellular matrix and cellular structures that are not resolved by SRS. (E) Volume fraction of tissue components in the hippocampus (B), the cerebral cortex (C), and the white matter (D). (Scale bars, 50 µm.)

