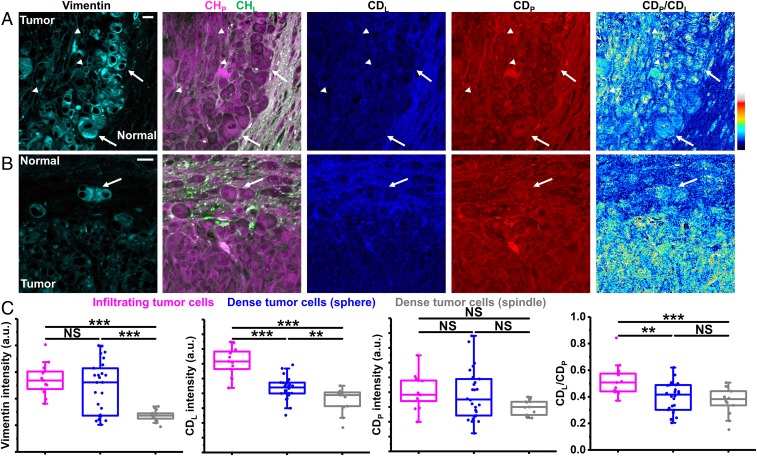
Fig. 7.
Correlative DO-SRS and immunofluorescence of glioblastoma. (A) Correlative images of immunolabeled vimentin, label-free SRS, and DO-SRS show two types of dense tumor cells: arrows indicate sphere-shaped dense tumor cells and arrowheads indicate spindle-shaped dense tumor cells. (Scale bar, 20 µm.) (B) Correlative images of immunolabeled vimentin, label-free SRS, and DO-SRS show infiltrating tumor cells (arrow). (Scale bar, 20 µm.) (C) Intensities of vimention, CDL, CDP, and CDL/CDP of infiltrating tumor cells (n = 13 cells), sphere-shaped dense tumor cells (n = 26 cells), and spindle-shaped dense tumor cells (n = 13 cells), from one mouse. Statistical significance was determined by one-way ANOVA with the Holm–Bonferroni method. **P < 0.01 and ***P < 0.001. NS, not significant.

