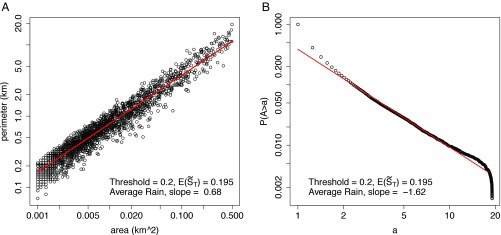
Fig. 3.
Relationships between area and perimeter of soil moisture islands and the distribution of tree clusters. (A) Perimeter vs. area of soil moisture islands. Here and for the case of average rain and threshold equal to 0.2. It shows that with Plots of perimeter vs. area with different rainfall and thresholds are similar and can be found in SI Appendix, Fig. S5. (B) The distribution function for tree clusters plotted at log–log scale, where

