Fig. 1.
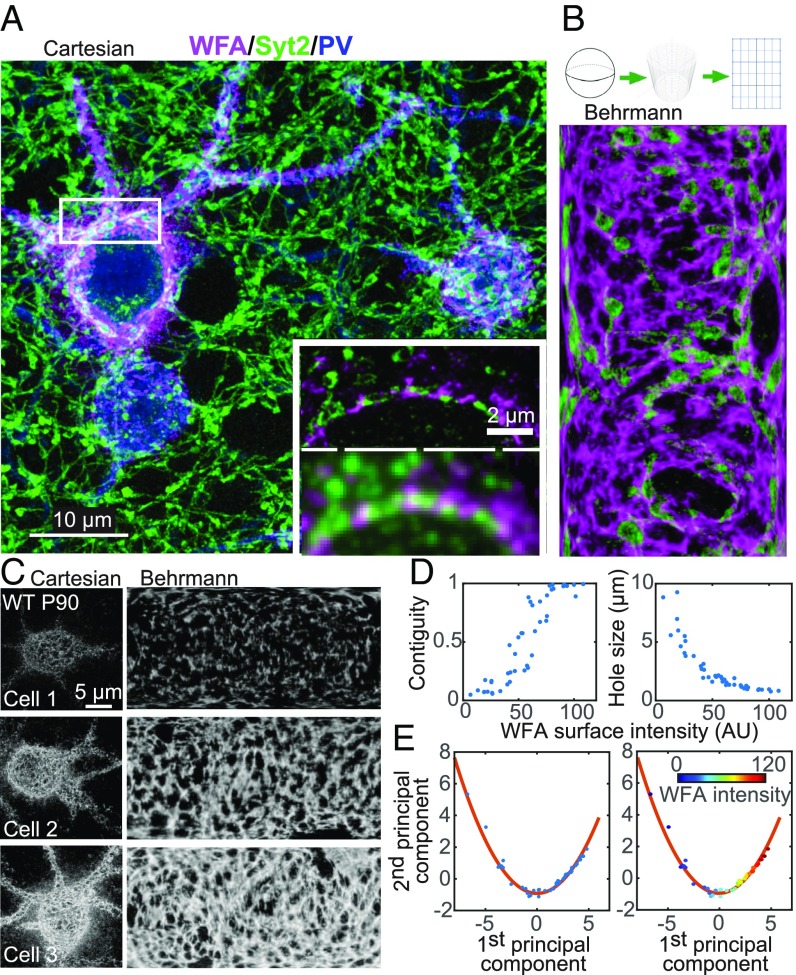
Structural characterization of the PNN with serial-section superresolution STORM imaging. (A) Representative maximum-intensity projection STORM image through 6 μm of tissue centered around layer 4 of the mouse primary visual cortex, V1 (magenta, WFA; green, Syt2; blue, PV). (Scale bar, 10 μm.) (A, Inset) Comparison of conventional (Bottom) and STORM (Top) images of a single 70-nm section in the boxed region. (Scale bar, 2 μm.) (B) Behrmann equal-area cylindrical surface projection of the PNN ensheathing a PV+ cell and inhibitory synapses perforating the PNN. (B, Top) Schematic of the projection method (SI Appendix, Materials and Methods). (B, Bottom) Behrmann equal-area cylindrical surface projection of WFA (magenta) and Syt2 (green) signals of a 500-nm-thick region centered around the radial peak of the WFA signal surrounding a PV+ cell. (C) Three representative examples of WFA+ PV+ cells with increasing WFA intensities from wild-type P90 mice. (C, Left) Maximum-intensity projection STORM images of WFA in Cartesian coordinates. (C, Right) Behrmann equal-area cylindrical surface projections through a 500-nm-thick region centered around the radial peak of the WFA signal. (D) Bivariate plots of the contiguity of the WFA signal (Left) and the hole size in the PNN (Right) versus WFA surface intensity. Each dot represents a single imaged cell. WFA surface intensity is defined as the mean intensity of the WFA signal across the entire cell surface for each cell. Contiguity is defined as the fraction of the WFA signal in the largest connected component for each cell. Hole size is defined as the mean effective radius of the holes in the PNN for each cell. (E) Principal component analysis for structural metrics of PNNs around WFA+ PV+ cells in P90 animals. Metrics of the PNN structure, including WFA surface intensity, contiguity, and hole size, as defined here, as well as five other metrics as defined in SI Appendix, Fig. S3, are used in the principal component analysis. (E, Left) The first two components of the principal component analysis are plotted for individual P90 cells (blue dots) and fit to a quadratic function (red line). (E, Right) Same as Left, but with dots color-coded according to the WFA surface intensity for each cell.

