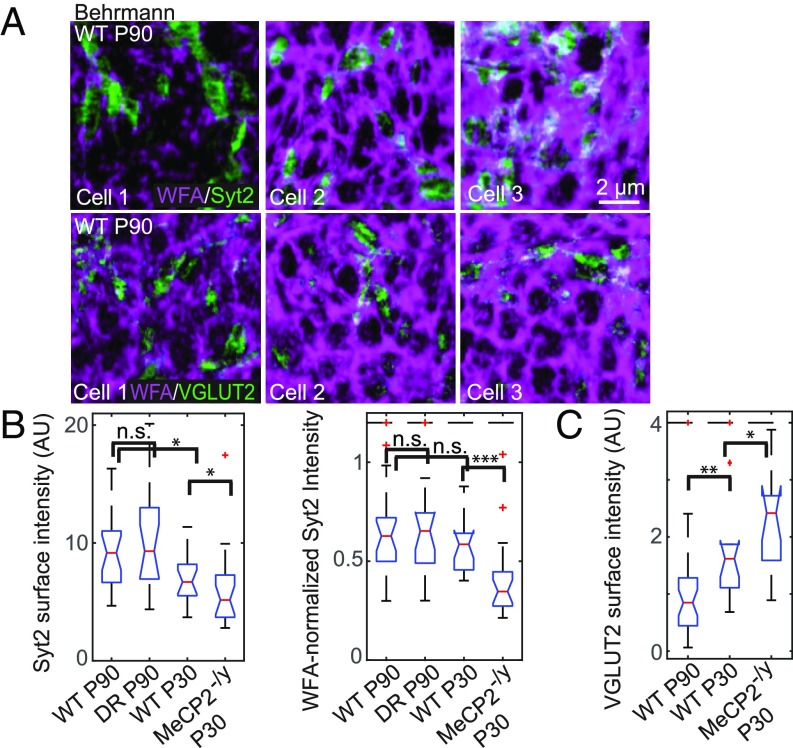
Fig. 4.
Synaptic contacts perforating the PNN onto PV+ cells during normal development and in dark-reared or MeCP2-deficient mice. (A) Behrmann equal-area cylindrical surface projections of two-color STORM images of WFA (magenta) and synaptic proteins (green; Syt2 for Top and VGLUT2 for Bottom) in wild-type P90 animals. Only a representative portion of each cell is shown in each image. (Scale bar, 2 μm.) A scale bar is included for these small-area Behrmann projections, as the nonlinear distortion is relatively small over such a small area. (B) Box and whiskers plots for Syt2 surface intensity on individual WFA+ PV+ cells in animals across developmental and perturbation conditions: wild-type P90, WT P30, DR P90, and MeCP2-/y P30. Syt2 surface intensity is defined as the mean intensity of the Syt2 signal across the entire cell surface for each cell. (B, Left) Absolute Syt2 surface intensities. (B, Right) WFA-normalized Syt2 surface intensities (ISyt2/IWFA0.65). Red lines denote median values; notches denote a 95% confidence interval around the median; boxes denote the first and third quartiles of the data; whiskers denote the expected 99% values assuming a normal distribution; outliers are shown as red crosses; and those above a cutoff threshold are shown as a dashed line. Statistical significance is determined by a two-sided Kolmogorov–Smirnov test. n.s., P > 0.05; *P < 0.05, **P < 0.01, ***P < 0.001. (C) Same as B, Left but for the VGLUT2 surface intensity instead of the Syt2 surface intensity. VGLUT2 surface intensity is defined as the mean intensity of the VGLUT2 signal across the entire cell surface for each cell.

