Fig. 5.
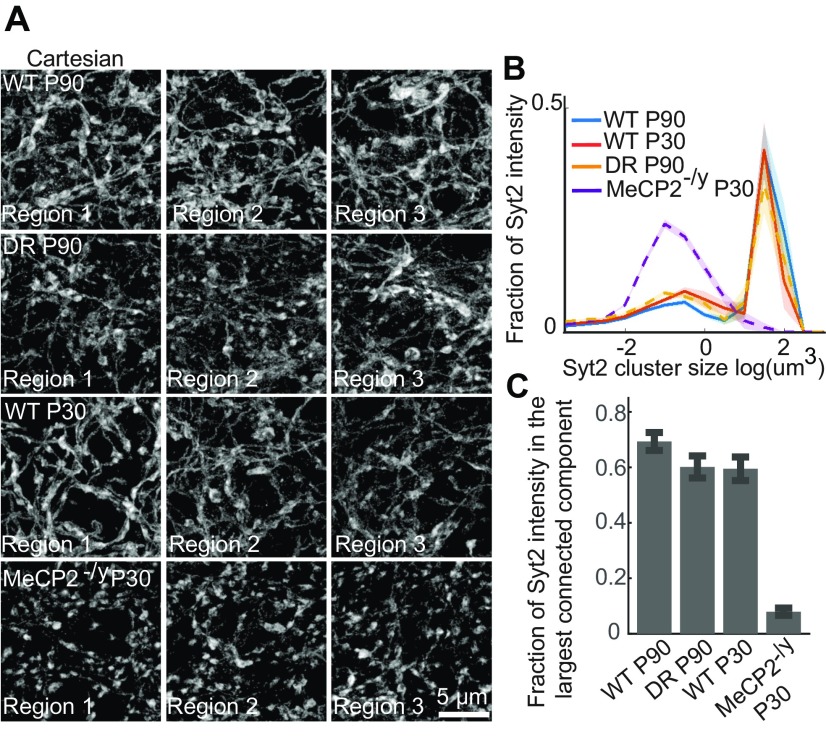
Morphology of the Syt2 signal surrounding PV+ cells is altered in MeCP2-/y mice. (A) Maximum-intensity projection STORM images of the Syt2 signal around representative WFA+ PV+ cells in animals across four conditions: WT P90 (first row), WT P30 (third row), DR P90 (second row), and MeCP2-/y P30 (fourth row). The images are presented in Cartesian coordinates. To reduce the background in the Syt2 maximum-intensity projections through thick volumes of tissue (5 μm), small clusters <70 nm3 in volume were removed. (B) Distributions of Syt2 cluster sizes for WT P90 (blue), WT P30 (red), DR P90 (yellow), and MeCP2-/y P30 (purple) samples for the regions surrounding each WFA+ PV+ cell. Data are plotted as the mean across imaged regions, with the SEM shown as shaded regions (n = 17 to 22 regions for each condition). (C) Fraction of Syt2 signals within each region that is in the largest connected component for WT P90, WT P30, DR P90, and MeCP2-/y P30 samples. The graph shows the mean across the imaged regions, and the error bars are the SEM (n = 17 to 22 regions for each condition).

