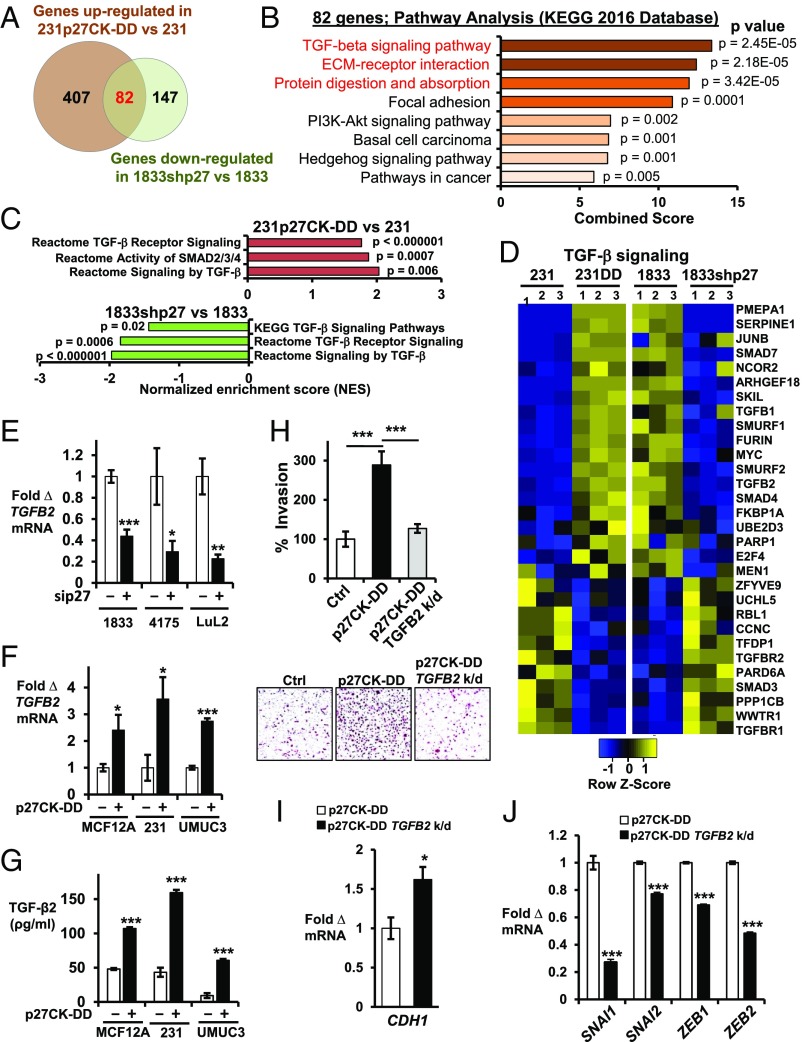
Fig. 2.
TGF-β signaling is regulated by p27. (A) Venn diagram depicts genes up-regulated in 231p27CK−DD vs. 231 (fold change >2.0, P < 0.005, q < 0.1) and down-regulated in 1833shp27 vs. 1833 (fold change <0.5, P < 0.005, q < 0.1). Numbers of genes are indicated. See also SI Appendix, Table S2. (B) GO analysis shows the top signaling pathways in the Kyoto Encyclopedia of Genes and Genomes (KEGG) 2016 database related to the 82 genes up-regulated in 231p27CK−DD vs. 231 and that decreased with p27 loss in 1833. See also SI Appendix, Fig. S1C. (C) Pathway analysis of these 82 differentially expressed genes. NES, normalized enrichment score. See also SI Appendix, Fig. S1D. (D) Heatmaps show differential expression of 30 TGF-β signaling pathway genes from three independent RNA-seq experiments. See also SI Appendix, Fig. S1 D and E and Table S3. (E) Effects of short-term siRNA-mediated p27 depletion (sip27) on TGFB2 mRNA by qPCR at 48 h in PI3K-activated, metastatic lines (1833, 4175, and LuL2) vs. scramble siRNA controls. (F and G) Effects of stable p27CK−DD expression on TGFB2 mRNA (F) and on secreted TGF-β2 (pg/mL) over 48 h (G) in the indicated lines. (H) Quantitative data (Top) and representative images (Bottom) of Matrigel invasion in 231, 231p27CK−DD, and TGFB2-depleted (TGFB2 k/d) 231p27CK−DD (for TGFB2 depletion, see SI Appendix, Fig. S4A). (I and J) Effects of TGFB2 depletion on CDH1 expression (I) and on EMT drivers (SNAI1, SNAI2, ZEB1, and ZEB2) (J). Means ± SEM graphed from three or more replicates of three or more different biologic assays (*P < 0.05, **P < 0.01, ***P < 0.001). 231DD, 231p27CK−DD. See also SI Appendix, Fig. S1 F–H.

