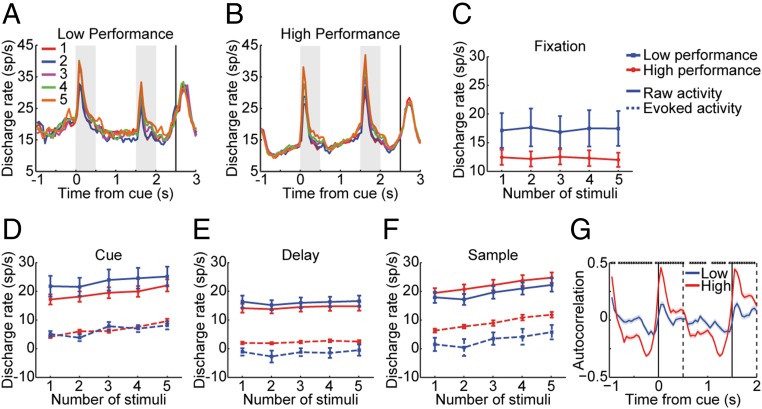
Fig. 3.
Activity in low- and high-performance sessions. (A and B) Population PSTH obtained during presentation of multiple stimuli for (A) low-performance sessions and (B) high-performance sessions. Data from two monkeys (n = 111 neurons). (C) Averaged firing rate of different stimuli number for low- and high-performance sessions during the fixation period. (D–F) Raw firing rate and evoked firing rate after subtracting the baseline fixation rate in the cue period (D), delay period (E), and sample period (F). (G) Autocorrelation function plotting correlation coefficient between firing rate in the first 500 ms of fixation and every successive 500-ms interval for low- and high-performance sessions.

