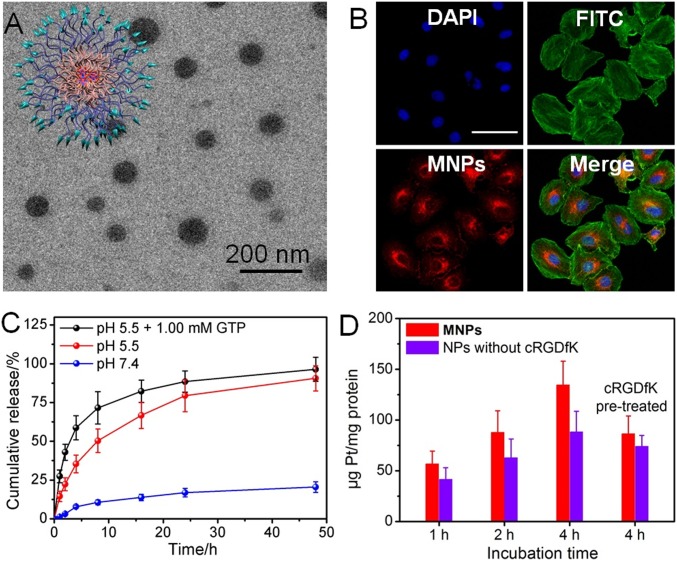
Fig. 3.
(A) TEM image of MNPs. (B) CLSM image of A2780CIS cells treated with MNPs. Blue fluorescence is from the nucleus stained with DAPI, green fluorescence is from the β-actin stained with FITC, and red fluorescence is from MNPs. (Scale bars: 25 μm.) (C) Release behaviors of the platinum-based drug under different conditions. (D) Time-dependent internalization of MNPs or NPs without cRGDfK by A2780CIS cells.

