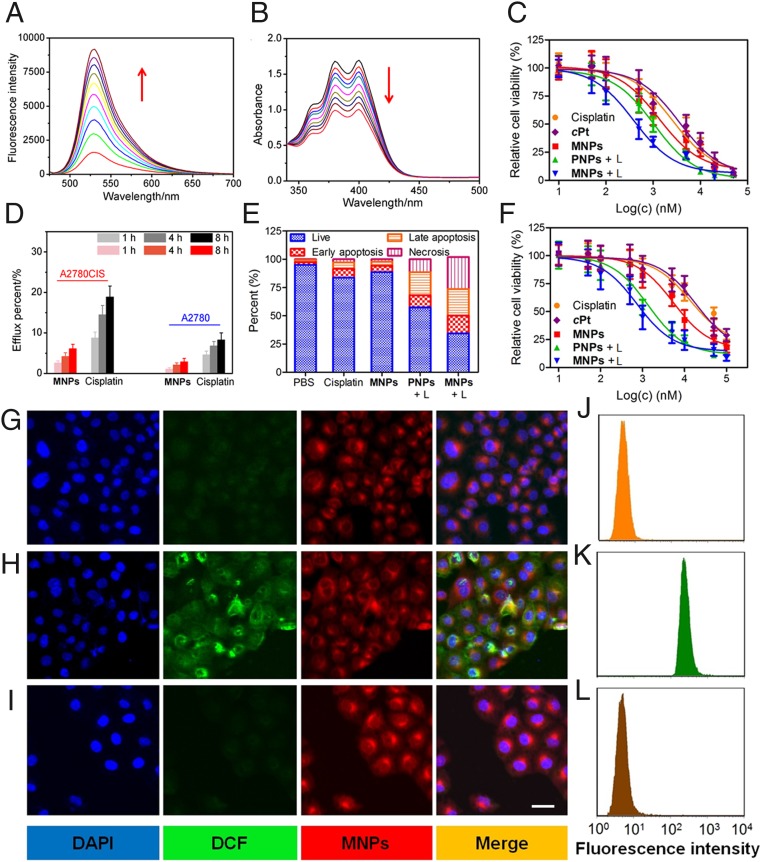
Fig. 4.
(A) The fluorescence spectra of SOSG solution (5.00 μM) in the presence of MNPs upon irradiation for different time. (B) UV-vis spectra of APDA in the presence of MNPs upon light irradiation for different time. (C) Cytotoxicity of different formulations against A2780 cells. (D) Efflux percentage of cisplatin and cPt from A2780 and A2780CIS cells after different incubation time. (E) Annexin-V/PI analyses of A2780CIS cells after different treatments. (F) Cytotoxicity of different formulations against A2780CIS cells. (G–L) CLSM images (G–I) and flow cytometric analysis (J–L) of A2780CIS cells after incubation with MNPs and DCF-DA with irradiation for 0 min (G–J), 5 min (H and K), and 5 min (I and L) in the presence of vitamin C (50.0 μM).

