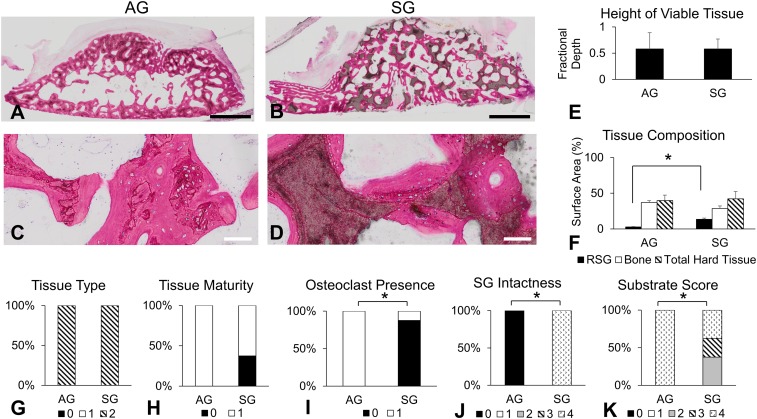
Fig. 4.
Bioreactor-generated tissue histological studies. (A–D) Representative histological photographs at low magnification (Top) and high magnification (Bottom) of AG (Left) and SG (Right) bioreactors. (Scale bars: Top, 2 mm; Bottom, 100 μm.) (E) Fractional depth measurements. (F) Surface area (%) of remaining SG (RSG), bone, and total hard tissue (RSG + bone). (G–K) Histological scoring results (score correlation is shown in SI Appendix, Table S2). An asterisk indicates statistically significant differences (*P < 0.05). Error bars represent SD. AG (n = 6) and SG (n = 8) were used for all histological studies.

