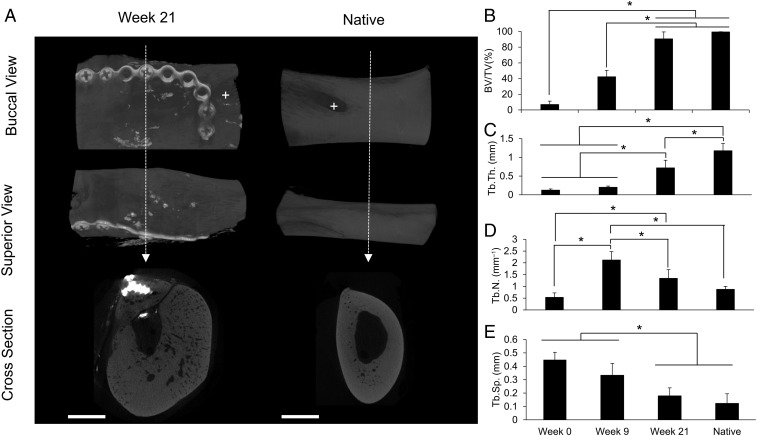
Fig. 7.
Mandibular radiological studies. (A) Representative reconstructions of hemimandibles postreconstruction (Left) and the contralateral native mandible (Right). Buccal (Top), superior (Middle), and cross-sectional (Bottom) views are shown. The dotted arrow refers to the site of cross-section. (Scale bar: 5 mm.) +, mental foramen. (B–E) BV/TV, Tb.Th., Tb.N., and Tb.Sp [week 0 (n = 6), week 9 (n = 6), week 21 (n = 5), and native (n = 5); x axis shared]. Week 0 and week 9 groups are the same as those shown in Fig. 3. Error bars represent SD. An asterisk indicates statistically significant differences (*P < 0.05).

