Fig. 1.
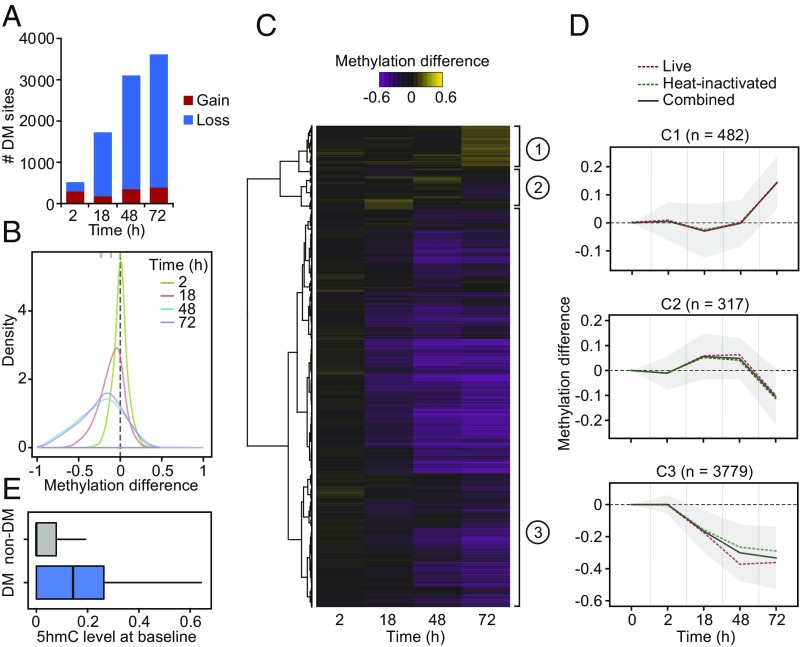
(A) Barplots showing the number of differentially methylated (DM) CpG sites identified at a |methylation difference| > 10% and FDR < 0.01 (y-axis) at each time point after MTB infection (2, 18, 48, and 72 h [h]) (x-axis). (B) Distribution of differences in methylation between infected and noninfected cells at DM sites, at each time point. (C) Heatmap of differences in methylation constructed using unsupervised hierarchical clustering of the 4,578 DM sites (identified at any time point using live and heat-inactivated MTB-infected samples combined; y-axis) across four time points after infection, which shows three distinct patterns of changes in methylation. (D) Mean differences in methylation of CpG sites in each cluster across all time points; shading denotes ±1 SD. For visualization purposes, we also show the 0h time point, where we expect no changes in methylation. (E) Boxplots comparing the distribution of 5hmC levels in noninfected DCs between non-DM and DM sites (Cluster 3).

