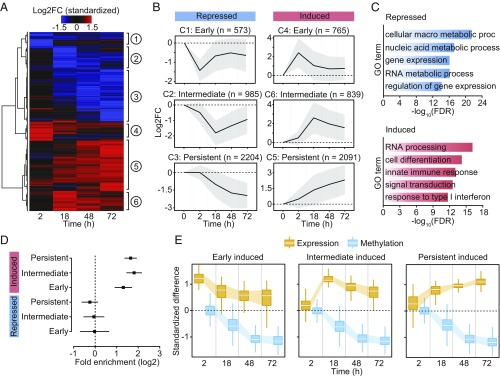
Fig. 2.
(A) Heatmap of differences in expression (standardized logtwofold changes) constructed using unsupervised hierarchical clustering of the 7,457 differentially expressed genes (identified at any time point) across four time points after MTB infection. (B) Mean logtwofold expression changes of genes in each cluster across all time points; shading denotes ±1 SD. For visualization purposes, we also show the 0 h time point, where we expect no changes in expression. (C) Gene ontology enrichment analyses among genes that are repressed or induced in response to MTB infection. (D) Enrichment (in log2; x-axis) of differentially expressed genes associated with differentially methylated CpG sites (Cluster 3). Error bars show 95% confidence intervals for the enrichment estimates. (E) Boxplots showing the distribution of standardized differences in methylation of DM sites in Cluster 3 (blue) along with the corresponding standardized differences in expression of the associated genes (orange), across all time points.

