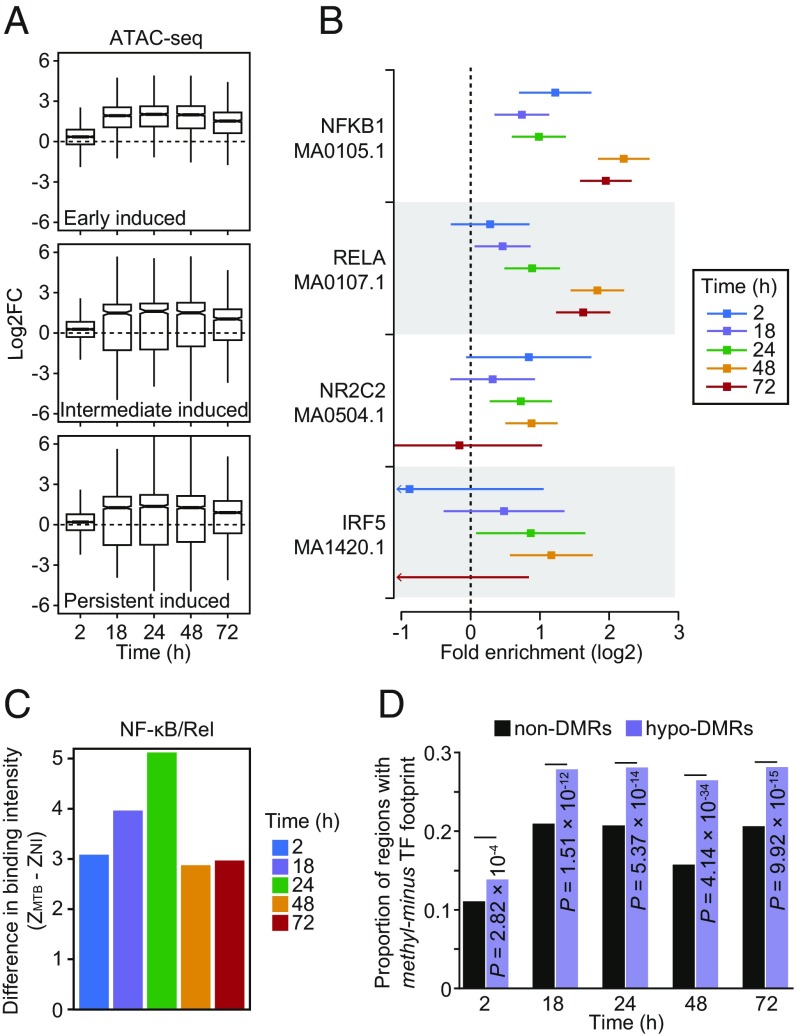
Fig. 4.
(A) Boxplots showing the distribution of logtwofold changes in chromatin accessibility between noninfected and MTB-infected DCs across the five time points of infection (2, 4, 18, 24, 48, and 72 h) for open chromatin regions associated with the three classes of induced genes described in Fig. 2 A and B. (B) TF binding motifs for which the number of well-supported footprints (posterior probability > 0.99) within hypomethylated regions (i.e., the combined set of DM sites for all four time-points) were enriched (FDR < 0.01) relative to non-DMRs (with 250 bp flanking the start and end) in MTB-infected DCs. The enrichment factors (x-axis) are shown in a log2 scale and error bars reflect the 95% confidence intervals. A complete list of all TF binding motifs for which footprints are enriched within hypomethylated regions can be found in Dataset S5. (C) Barplots showing significant differences in TF occupancy score predictions for NF-κB/Rel motifs between MTB-infected and noninfected DCs (ZMTB − ZNI; y-axis; see Materials and Methods) across all time points (x-axis). A positive Z-score difference indicates increased TF binding in hypomethylated regions after MTB infection. (D) Proportion of regions that overlap a methylation-sensitive (“methyl-minus”; reported in Yin et al. [33]) TF footprint (y-axis) observed among non-DMRs and hypomethylated regions (or hypo-DMRs; see Materials and Methods).

