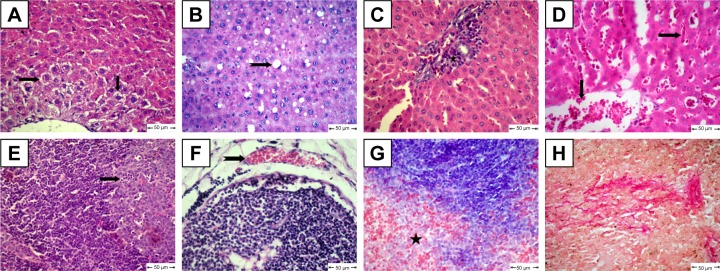
Figure 6.
Histopathological changes in diabetic rats.
Notes: (A) Liver shows centrilobular hepatic necrosis (arrows); (B) liver shows clear nonstaining vacuoles in hepatic cells (notched arrows); (C) liver shows focal areas of Kupffer-cell proliferation in portal area (star); (D) liver shows dilatation and congestion of central veins and in hepatic sinusoids (arrows); (E) lymph nodes show apoptotic lymphocytes (arrow); (F) lymph nodes show subcapsular vascular congestion (notched arrow); (G) spleen shows accumulation of collagen deposition in red pulp (star); H&E. (H) Collagen fibers in spleen confirmed by van Gieson stain.

