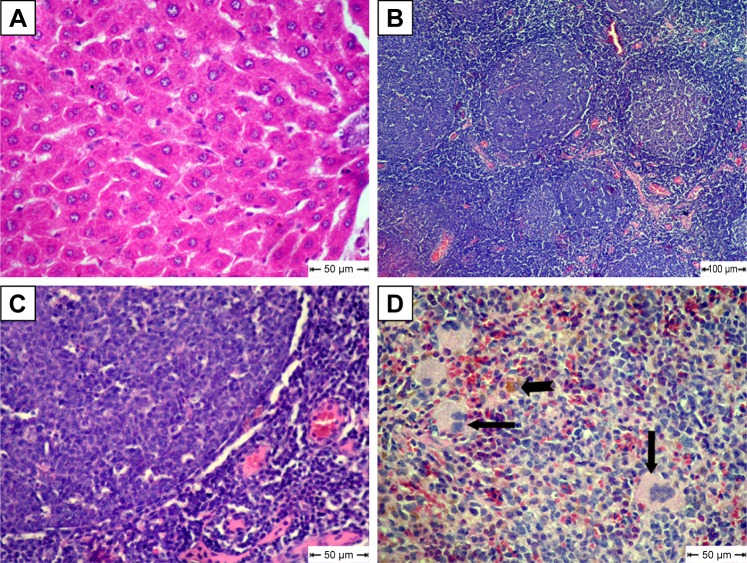
Figure 8.
Histopathological changes in metoclopramide nanoparticle–treated group.
Notes: (A) Liver shows normal hepatic cords; (B) lymph nodes show follicular hyperplasia; (C) lymphoid follicles heavily populated with small lymphocytes; (D) spleen shows extramedullary formation of hematopoietic cells (arrow) and hemosiderosis (notched arrow); H&E.

