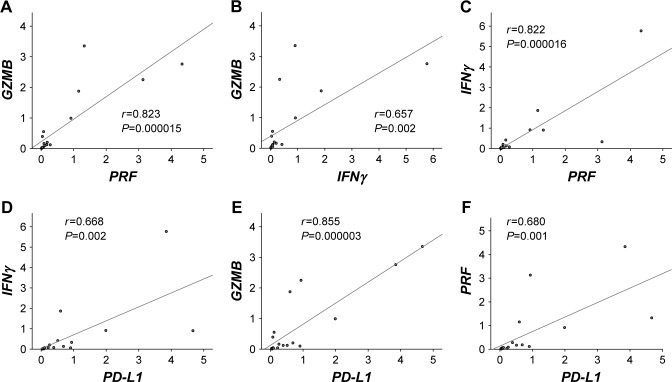
Figure 1.
Correlation between each T cell activation marker and PD-L1.
Notes: The relationship between gene expressions and clinical outcomes of human osteosarcoma clinical specimen was evaluated. (A) Scatter plot and approximate curve of GZMB and PRF expression (correlation coefficient, r=0.823; P<0.0001). (B) Scatter plot and approximate curve of GZMB and IFNγ expression (correlation coefficient, r=0.657; P=0.0022. (C) Scatter plot and approximate curve of IFNγ and PRF expression (correlation coefficient r=0.822, P<0.0001). (D) Scatter plot and approximate curve of expression of IFNγ and PD-L1 (correlation coefficient, r=0.668; P=0.0018). (E) Scatter plot and approximate curve of expression of GZMB and PD-L1 (correlation coefficient, r=0.855; P<0.0001). (F) Scatter plot and approximate curve of expression of PRF and PD-L1 (correlation coefficient r=0.680; P=0.0013).

