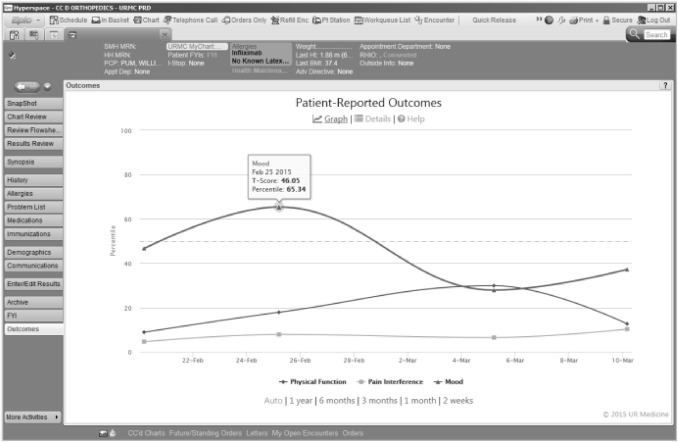
Figure 1.
Longitudinal Presentation of PROMIS CAT Scores in Electronic Medical Record. An example of a patient’s PROMIS scores as seen in the patient’s Electronic Medical Record (EMR). Scores are graphically represented as a percentile rank, based on the general population. This display is present in the larger context of the EMR under the Web activity ‘‘Outcomes’’ vertical tab. The graph is interactive and can display one or all three of the PROMIS scores, and using the mouse hovering over one of the points will show details of the that particular data point, including the associated T-Score.

