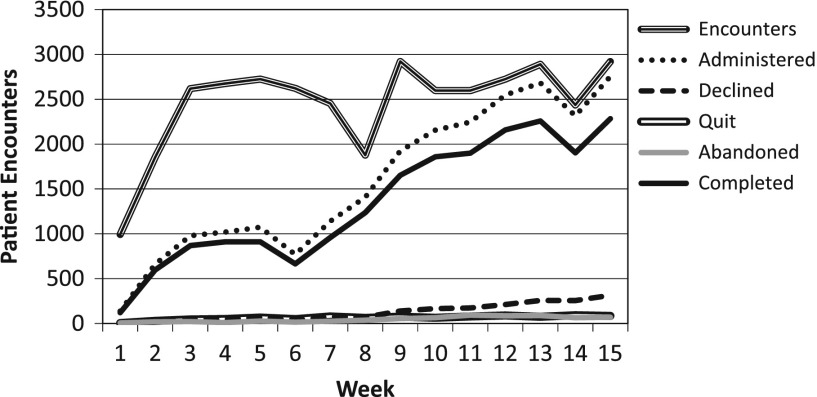
Figure 2.
Weekly Implementation Tracking Metrics; Volume. The graph shows the weekly progression in administration volume over the first 15 weeks. The increase in volume is directly related to the “rollout” by which additional providers and sub- specialties were added each week. Week-to-week decreases were due to scheduling irregularities whereby providers were not seeing patients.

