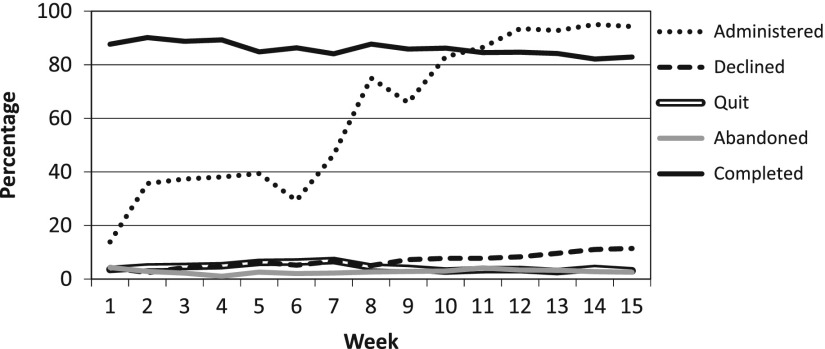
Figure 3.
Weekly Implementation Tracking Metrics; Completion rates. The graph shows the weekly progression in administration and completion rates over the first 15 weeks. The completion rate stays above our goal of 80% throughout the implementation. Increasing decline rates after week 9 may be a result of patient fatigue. Relative low rates of quit and abandoned indicate adequate time to complete and adequate wireless infrastructure.

