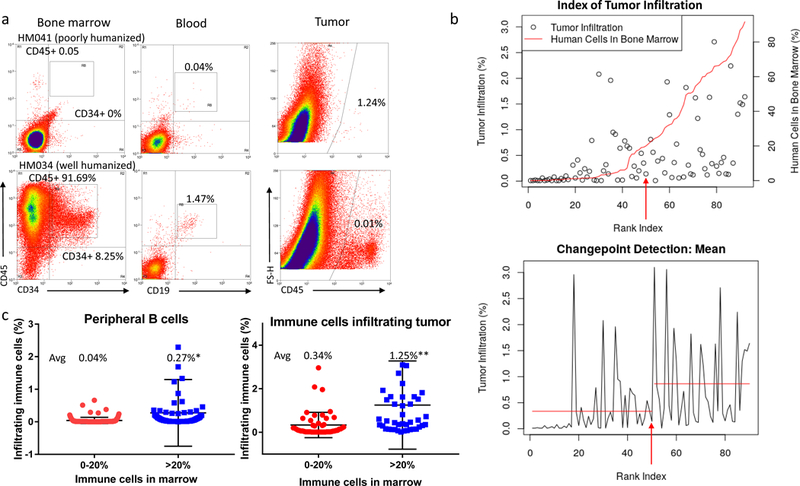
Figure 3. Defining the degree of humanization at which immune cells infiltrate into implanted tumors.

(a) Cytometry showing animals with a higher percentage of human immune cells in their bone marrow are also more likely to have human immune cells within their peripheral blood and infiltrating implanted tumors. (b) Panel 1: Graph showing the relationship between immune cells in the bone marrow (red line) and immune cell infiltration into tumors (circles), organized by mouse – ranked according to their percentage of human bone marrow – on the X axis. The arrow indicates the mouse identified as the changepoint between poorly- and well-humanized mice. Panel 2: Changepoint analysis showing the increase in the mean percentage of immune infiltration in mice whose bone marrow is composed of at least 20% human immune cells. The arrow indicates the changepoint mouse. (c) Plots depicting increased human B cell content in the peripheral blood of well-humanized mice (*P=0.01; left) and increased immune cells infiltration in tumors implanted on well-humanized mice (**P<0.01; right).
