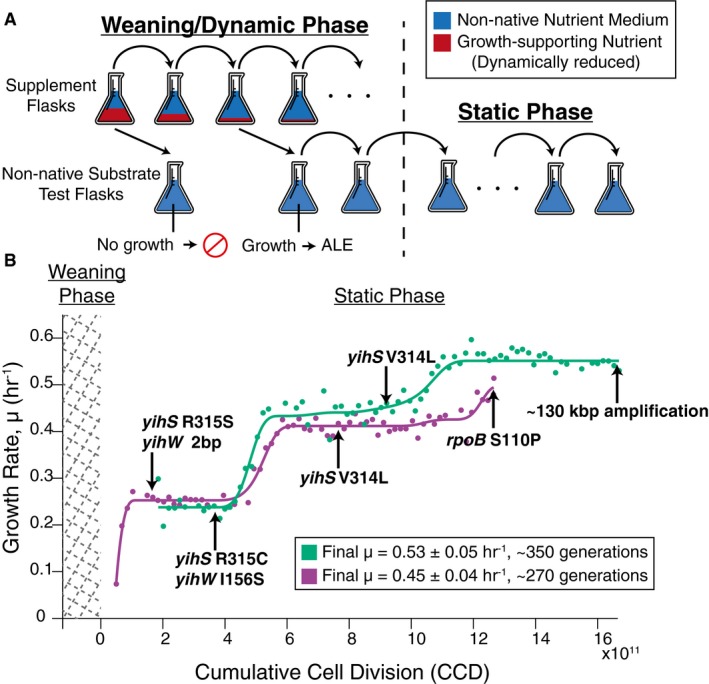
Figure 1. Laboratory evolution method schematic and the growth trajectory of D‐lyxose experiments.

- A schematic of the two‐part adaptive laboratory evolution (ALE) experiments. The “weaning/dynamic environment” stage involved growing cells in supplemented flasks containing the non‐native substrate (blue) and growth‐promoting supplement (red). As cultures were serially passed, they were split into another supplemented flask as well as an “non‐native substrate test flask” containing only the non‐native nutrient (no supplement) to test for the desired evolved growth phenotype. The “static environment” stage consisted of selecting for the fastest growing cells and passing in mid log phase.
- Growth rate trajectories for duplicate experiments (n = 2 evolution experiments per substrate condition) (green and purple) for the example case of D‐lyxose. Population growth rates are plotted against cumulative cell divisions. Clones were isolated for whole‐genome sequencing at notable growth rate plateaus as indicated by the arrows. Mutations gained at each plateau are highlighted beside the arrows (mutations arising earlier along the trajectory persisted in later sequenced clones).
