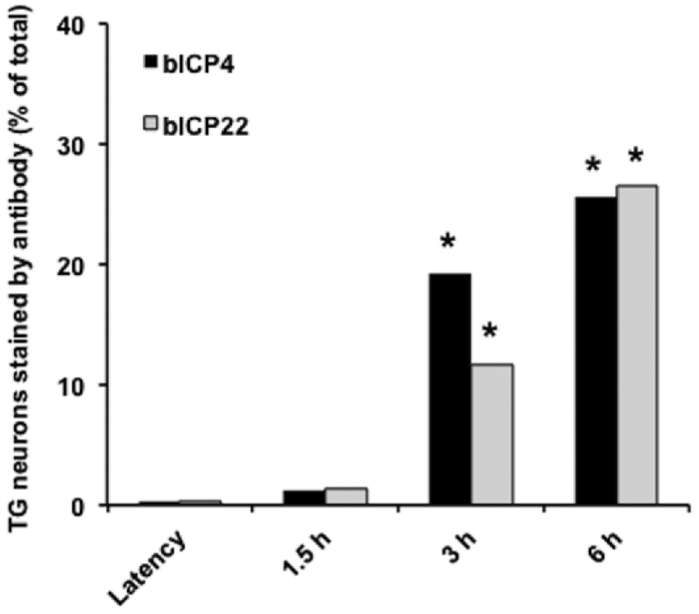
Figure 4. Estimating the number of neurons that express bICP4 and bICP22 during reactivation from latency.
The % of bICP4+ TG neurons was estimated by counting the following number of TG neurons: latency (538), 1.5 h after DEX treatment (515), 3 h after DEX treatment (668), and 6 hours after DEX treatment (546). The % of bICP22+ TG neurons was estimated by counting the following numbers of TG neurons: latency (582), 1.5 h after DEX (497), 3 h after DEX treatment (734), and 6 h after DEX treatment (597). An asterisk denotes a significant increase in bICP4+ or bICP22+ TG neurons relative to latency. The asterisks denote significant differences (P<0.001) in the numbers of bICP4+ neurons as determined by a Student t test.

