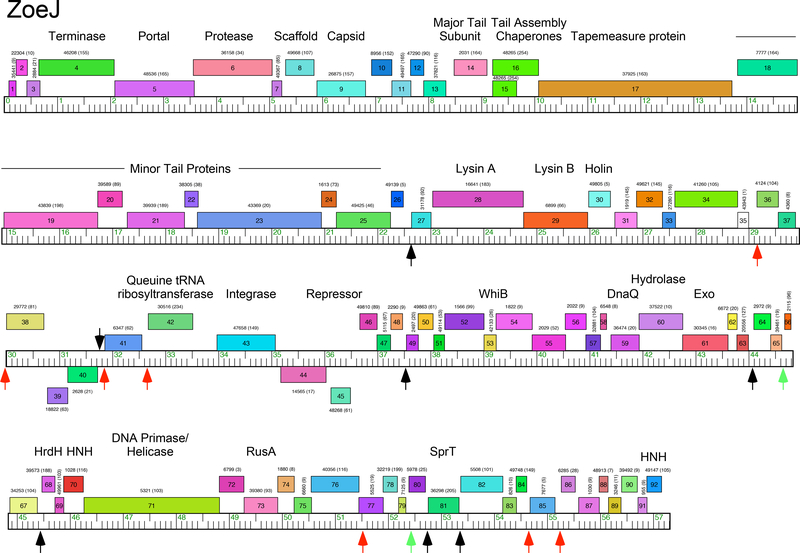
Figure 1. Genome map of mycobacteriophage ZoeJ.
The genome of ZoeJ is represented as a ruler with kbp markers with the predicted genes as colored boxes above or below the genome corresponding to rightwards- and leftwards-transcription, respectively. Gene names are shown within each box, and the corresponding phamily number shown above or below each gene with the number of phamily members in parentheses. The map was drawn using Phamerator 36 and the database ‘actinobacteriophages_draft’ as of July 2018. Black and red vertical arrows indicate the locations of Start Associated Sequences (SAS; see Table 1), with the red arrows indicating those that also include an Extended Start Associated Sequence (ESAS; see Table 2). Green vertical arrows indicate positions of ESAS site that lack a linked SAS. Putative gene functions are indicated.

