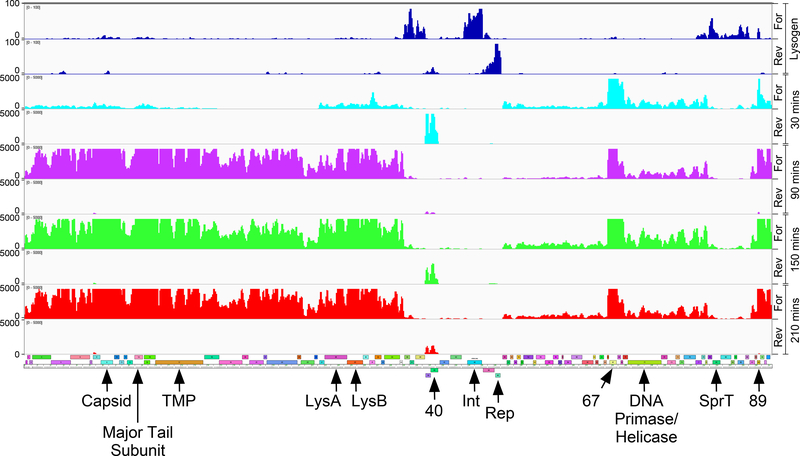
Figure 6. ZoeJ transcription in lytic growth.
RNA was isolated at 30, 90, 150, and 210 minutes (shown in aqua, purple, green, and red, respectively) after infection of M. smegmatis with ZoeJ; reads mapping to forward (For) and reverse (Rev) strands are shown as indicated. A map of the ZoeJ genome is shown below (see Fig. 1 for details). The lysogen RNAseq data is shown for comparison in blue at the top. The positions of several key genes are indicated (9, capsid subunit; 14, major tail subunit; 45, repressor; TMP, Tape Measure Protein).

