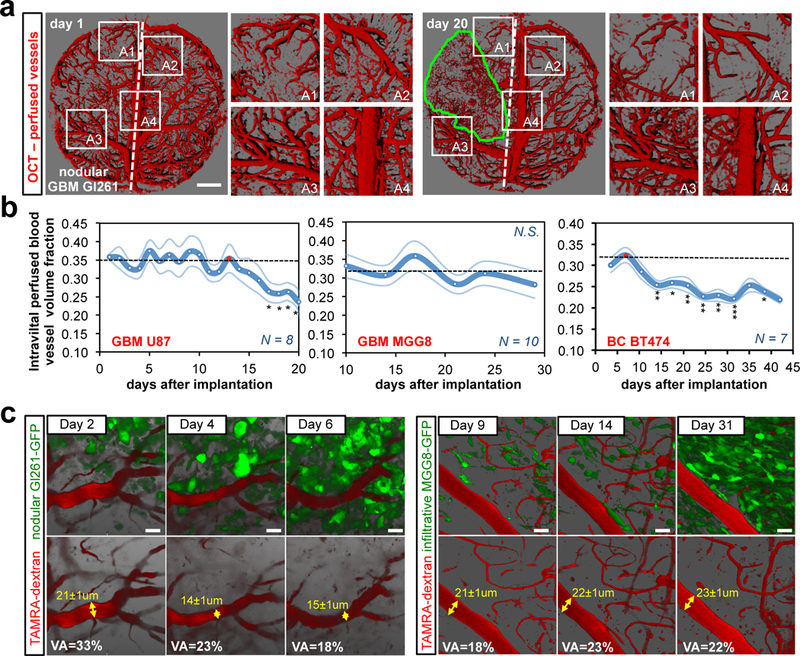
Fig. 2. Reduced vessel perfusion in the brain tissue around nodular tumors.

(a) Longitudinal OCT intravital angiography (perfused vessels) of the nodular Gl261 mouse model. U87 and BT474 are presented in Fig. S3B, D. Scale bar: 1 mm. (b) Longitudinal quantitative analysis of the vascular perfused volume fraction in the surrounding tissue. GBM U87: Day17 p=0.025; Day18 p=0.011; Day19 p=0.045; day20 p=0.037 vs the red-dotted time-point. BC BT474: Day14 p=0.001; Day18 p=0.024; Day21 p=0.003; day25 p=0.005; day28 p=0.001; day32 p<0.001; day38 p=0.035 vs the red-dotted time-point. Data are mean ± s.e.m. (c) Intravital longitudinal multi-photon imaging depicting changes in vessel diameter in the nodular Gl261-GFP and in the infiltrative MGG8-GFP GBM mouse models. GFP (green, tumour cells) and TAMRA-Dextran (red, 2MDa-dextran, blood flow). VA = vascular area. Scale bar: 20 μm.
