
Fig. 3. Neuronal deformation and death in the brain tissue around nodular tumors.
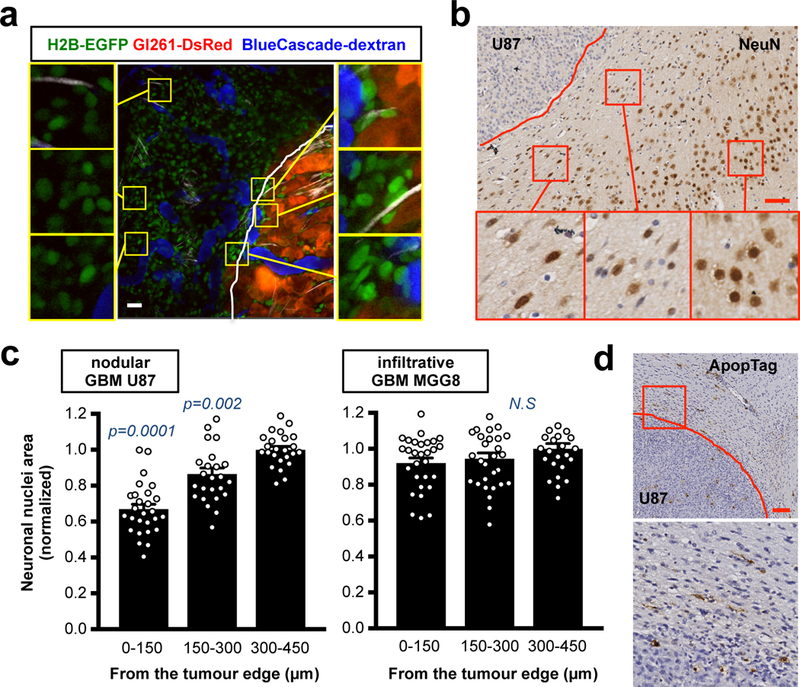
(a) Intravital multi-photon imaging of brain nuclei around the nodular mouse Gl261-DsRed GBM implanted in H2B-EGFP mouse (CAG::H2B-EGFP C57/BL6). GFP (green, nuclei within the brain tissue), DsRed (red, tumour cells) and BlueCascade (blue, 2MDa-dextran, blood flow). Insets are magnifications of the yellow squares. Vascular area (VA) is the quantification (%) of these exact images. Scale bar: 20 μm. (b) IHC of neuronal nuclei (NeuN) in the surrounding brain tissue of mice with the nodular U87 tumour. Representative image from a cohort of 10 mice with tumour. Insets are magnifications of the red squares. Scale bar: 50 μm. (c) Quantification of neuronal nuclear area in the brain tissue around nodular or infiltrative tumors. Data are mean ± s.e.m. p-values are vs “300–450 from the tumour edge”. (d) Apoptosis (ApopTag) at the interface between the nodular U87 tumour and the normal brain tissue. Representative image from a cohort of 10 mice with tumour. Inset is magnification of the red square. Scale bar: 100 μm.