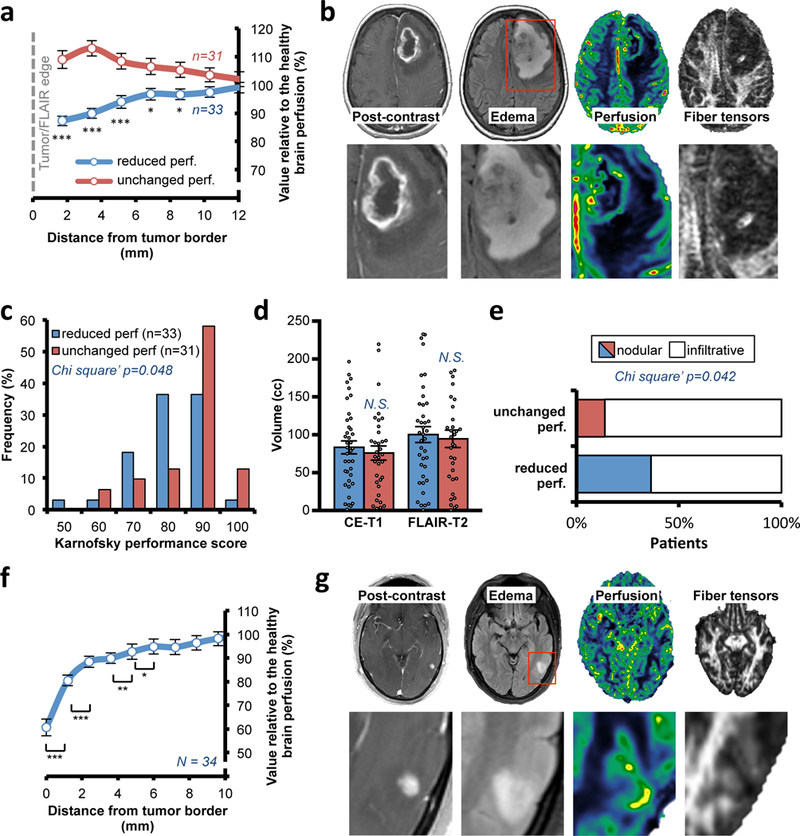
Fig. 4. Reduced perfusion in the surrounding normal tissues in GBM and BC brain met patients.

(a) Quantification of the local perfusion in surrounding normal brain tissue from immediately adjacent to the peri-edematous region of the GBM to the region 12 mm away from the tumor edge. The cohort of 64 pre-surgery GBM patients was divided in patients with a reduced perfusion in the surrounding tissue (“reduced perf”) and patients with no difference in perfusion (“unchanged perf”). Data are mean ± s.e.m. Point 1.72 p<0.001 vs “unchanged perf”; point 3.44 p<0.001; point 5.15 p=0.001; point 6.87 p=0.014; point 8.59 p=0.019. (b) Representative pre-surgery GBM patient from a cohort of 33 patients with local reduced perfusion and fiber tensor signal in the surrounding tissue as well as midline shift. (c) Histograms of KPS in “reduced perf” and “unchanged perf” GBM patients. (d) CE-T1 and FLAIR-T2 volumes in the two classes with “reduced perf.” or “unchanged perf.” in the surrounding brain tissue. N.S., not significant. Data are mean ± s.e.m (N = 64 patients). (e) Classification of the patients in the two perfusion subclasses in based on the edematous (FLAIR-T2) MRI margins (N = 64 patients). Comparable result with CE-T1 MRI, Fig. S6B. (f) Quantification of the local perfusion in the brain tissue immediately surrounding the BC brain mets. Cohort of 34 BC patients (26 HER2-positive; 8 HER2-negative). Data are mean ± s.e.m. Point 0 p<0.001 vs point 1.2; point 1.2 p<0.001 vs point 2.4; point 3.6 p=0.010 vs point 4.8; point 4.8 p=0.013 vs point 6. (g) Representative BC HER2-negative patient from a cohort of 34 patients with local reduction of perfusion and fiber tensor signal in the surrounding tissue.
