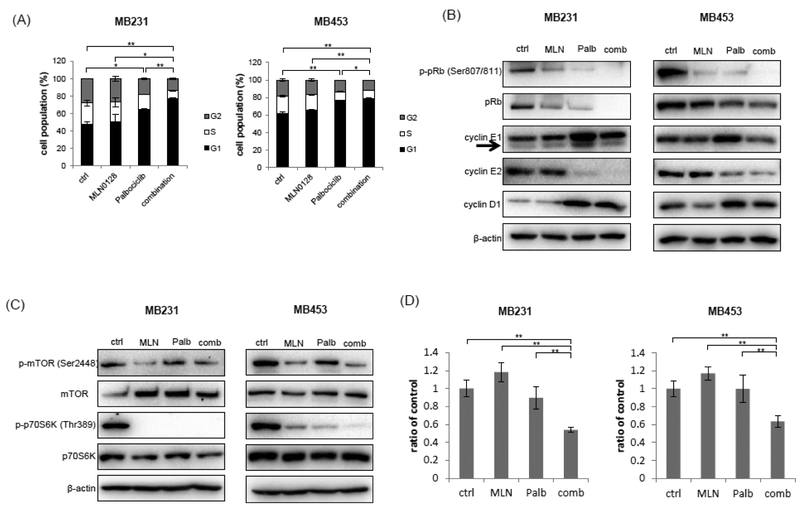
Fig. 4: The combination induced G1 arrest and reduced G1/S trantision related molecules and mTOR pathway.
MB231 cells were treated for 48 h with or without palbociclib at 250 nM and/or MLN0128 at 31.25 μM. MB453 cells were treated for 48 h with or without palbociclib at 62.5 nM and/or MLN0128 at 7.8125 nM. (A) Flow cytometric analyses were performed in MB231 and MB453. Data are expressed as cell population (%) and mean values ± SD, from duplicate measurements for each treatment. Statistic analyses of G1 cell population were subjected unpaired t test compared to control or combination treatment. *p < 0.05, **p < 0.01. (B and C) Lysates were prepared from cells from each traetment and evaluated through Western blot analysis. Arrows indicate the target bands. β-actin is shown as the loading control. (D) Cyclin E1 mRNA levels in MB231 and MB453 were mesaured by realtime PCR. ACTB was used as a reference. Data are expressed as the ratio of control and mean values ± SD, from triplicate measurements for each treatment. **p < 0.01.

