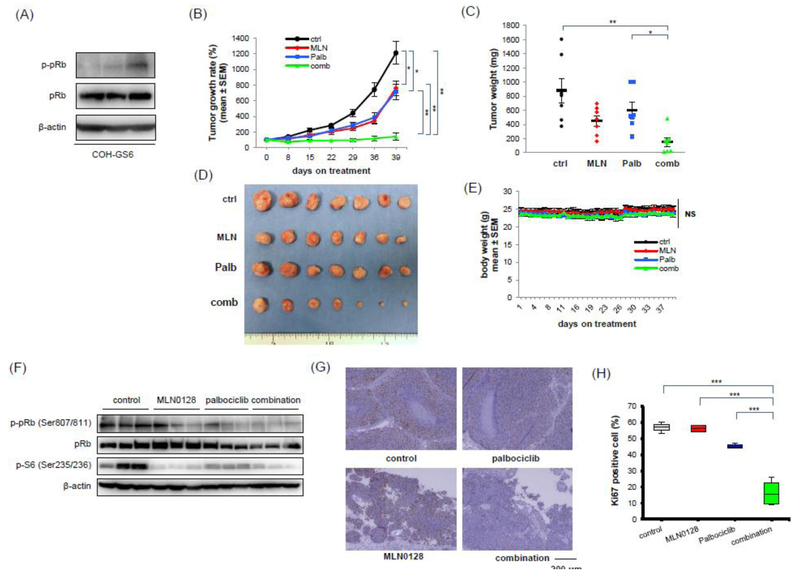
Fig. 5: Palbociclib in combination with MLN0128 showed a cooperative anti-tumor effect in pRb-expressing TNBC PDX tumors.
(A) Expressions of phospho-pRb and pRb were examined by Western blot in 3 different untreated tumors of COH_GS6. (B) Mice bearing COH_GS6 tumor received control vehicle, MLN0128, and/or palbociclib. All vehicle and drugs were administered 6 days each week. Data of tumor growth rate are expressed as the percentage of each tumor size on day 0, and are mean ± SEM. Tumor volume was monitored once a week. (n = 7) (C) Tumors were collected and their weights were measured on day 39. Black bars show mean values and the error bars represent SEM. (D) Pictures of tumors were taken when tumors were collected. The scale (cm) has been placed below the tumors. (E) Mice body weight was monitored at the time of treatment. Each color shows the body weight of each group of mice. Data are mean values ± SEM. (F) Tumor lysates were prepared. Tumors were collected 6 h after oral gavage of drugs at the last day. Western blot was performed using indicated antibodies. β-actin is shown as the loading control. (G) Representative image of IHC of Ki67 are shown for each treatment condition. A scale bar of 200 μm is shown below the images. (H) Data are expressed as the percentage of Ki67 positive cells in harvested tumors receiving each treatment [palbociclib group (n = 3), and other groups (n = 4)]. The boxes show the first quartile and third quartile of data and the lines in the box show median values. The bars at the end of box show 1.5 IQR. Statistic analyses were subjected to one-way ANOVA with Tukey’s multiple comparison post-hoc test for data of (B), (C), and (H), and unpaired t-test for data of (E). *p < 0.05, **p < 0.01, ***p = 0.001.

