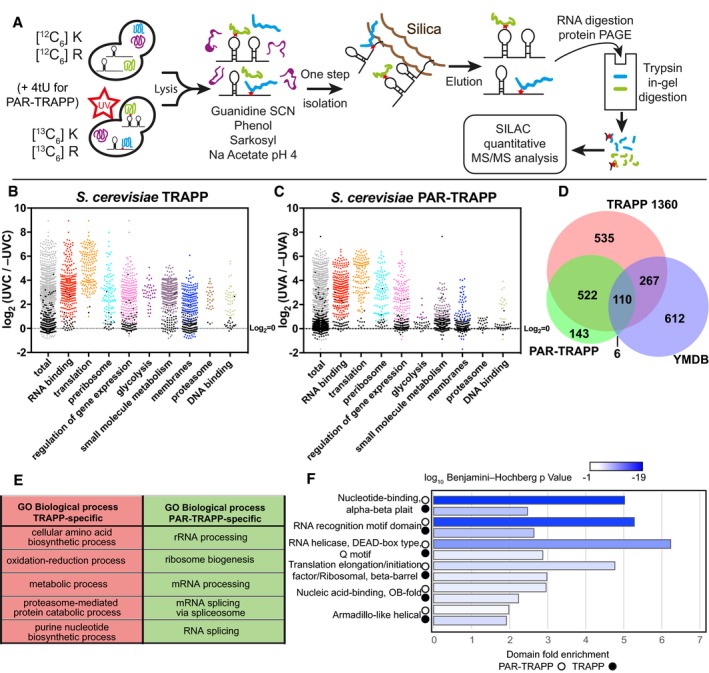
TRAPP and PAR‐TRAPP workflows used to identify RNA‐interacting proteins with SILAC MS‐MS. See the main text for details.
Scatter plot of Log2 SILAC ratios +UVC/−UVC (1,360 mJ cm−2) for Saccharomyces cerevisiae proteins, quantified with TRAPP. Proteins were subdivided based on the indicated GO term categories. Proteins belonging to GO terms “membrane” and “DNA binding” do not contain proteins mapping to GO terms “RNA metabolic process”, “RNA binding”, “ribonucleoprotein complex”. Black dots represent proteins that failed to pass statistical significance cut‐off (P‐value adjusted < 0.05).
Scatter plot of Log2 SILAC ratios +UVA/−UVA for S. cerevisiae proteins, quantified with PAR‐TRAPP. Proteins were subdivided based on the indicated GO term categories. Proteins belonging to GO terms “small molecule metabolism”, “membrane” and “DNA binding” do not contain proteins mapping to GO terms “RNA metabolic process”, “RNA binding”, “ribonucleoprotein complex”. Black dots represent proteins that failed to pass statistical significance cut‐off (P‐value adjusted < 0.05). See Methods and Protocols for calculation of significance.
Venn diagram showing the overlap between proteins identified in TRAPP and PAR‐TRAPP and proteins of intermediary metabolism annotated in the yeast metabolome database (YMDB).
5 most enriched GO terms amongst proteins identified only in TRAPP or exclusively in PAR‐TRAPP.
6 most significantly enriched domains (lowest P‐value) in PAR‐TRAPP‐identified proteins were selected if the same domain was enriched amongst TRAPP‐identified proteins. Domain fold enrichment in the recovered proteins is plotted on the x‐axis, while colour indicates log10 Benjamini–Hochberg adjusted P‐value.

