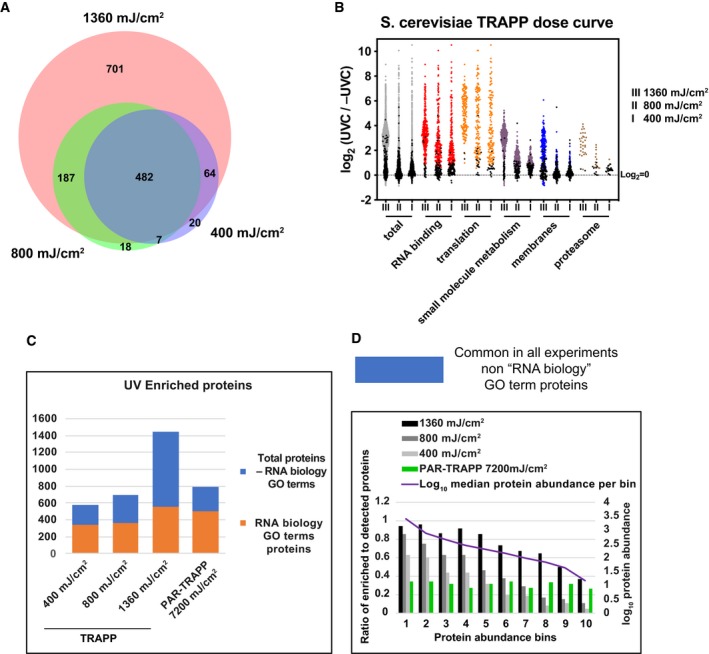
Figure 2. The effect of UVC dose in Saccharomyces cerevisiae on the proteins identified in TRAPP.

- Venn diagram showing the overlap between proteins identified in TRAPP using the indicated UVC irradiation regime.
- Scatter plot of Log2 SILAC ratios +UVC/−UVC (for the indicated UV doses) for S. cerevisiae proteins, quantified with TRAPP. Proteins were subdivided based on the indicated GO term categories. Proteins, belonging to GO terms “membrane” and “small molecule metabolism” do not contain proteins mapping to GO terms “RNA metabolic process”, “RNA binding”, “ribonucleoprotein complex”. Black dots represent proteins that failed to pass statistical significance cut‐off (P‐value adjusted < 0.05).
- Proteins, identified in TRAPP and PAR‐TRAPP were subdivided into 2 categories: “RNA biology” proteins (GO terms “RNA metabolic process”, “RNA binding”, “ribonucleoprotein complex”) (orange bars); Proteins, not classified with either of the 3 GO terms above (blue bars). Numbers of proteins in each category are plotted per experiment.
- Proteins quantified in both TRAPP and PAR‐TRAPP were filtered to remove proteins annotated with GO terms “RNA metabolic process”, “RNA binding”, “ribonucleoprotein complex” (blue bars in Fig 2C). The remaining proteins were split into 10 bins by abundance (see Materials and Methods). For each bin, the ratio between enriched to detected proteins was calculated as well as median protein abundance as reported by PaxDb.
