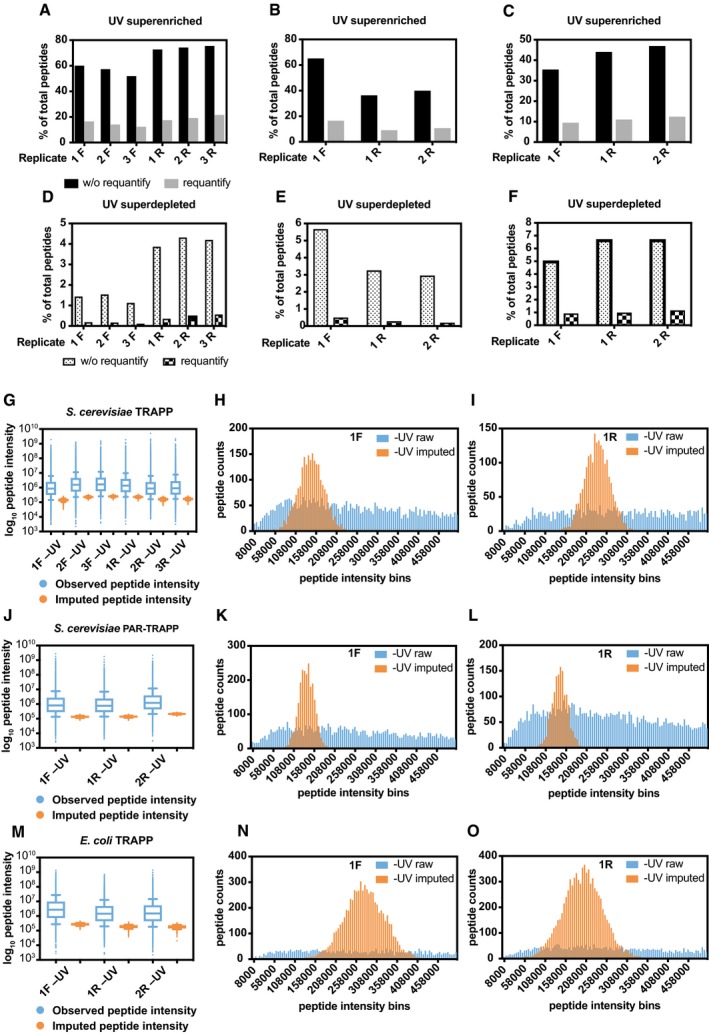
The percentage of peptides with reported intensity in +UV sample, but not in −UV sample (superenriched peptides) by MaxQuant in Saccharomyces cerevisiae TRAPP (at 1,360 mJ cm−2) SILAC quantification experiments without (black bars) or with (grey bars) “requantify” option enabled. 3 biological repeats had light‐labelled cells UV irradiated (1F, 2F,3F), while three other repeats (1R, 2R, 3R) had heavy‐labelled cells UV irradiated.
The data of S. cerevisiae PAR‐TRAPP experiments were analysed the same way as in (A).
The data of E. coli TRAPP experiments were analysed the same way as in (A), except the 2 biological repeats, which had light‐labelled cells UV irradiated, were labelled 1R and 2R.
The percentage of peptides with reported intensity in −UV sample, but not in +UV sample (superdepleted peptides) by MaxQuant in S. cerevisiae TRAPP (at 1,360 mJ cm−2) without (dotted) or with (chequered) “requantify” option enabled. Sample labelling as in (A).
The data of S. cerevisiae PAR‐TRAPP experiments were analysed the same way as in (D).
The data of E. coli TRAPP (at 1,360 mJ cm−2) experiments were analysed the same way as in (D), sample labelling was as in panel (C).
Box plot of Log10 peptide intensity of −UV peptides from S. cerevisiae TRAPP (at 1,360 mJ cm−2) (blue) samples (labelling as in (A)), plotted together with Log10 peptide intensity values imputed by imputeLCMD R package for −UV samples (orange). Box represents values between 25th and 75th percentiles, while whiskers represent 10th and 90th percentiles. All other data are represented as points below or above 10th or 90th percentiles, respectively. Line inside the box shows median value.
Histogram of peptide intensity frequency obtained from −UV sample (1F), plotted for intensities from 0 to 5 × 10⁵ units. Colour labelling is as in (G).
Same as panel (H), performed for sample 1R which had reversed SILAC labelling, compared to the sample analysed in panel (H).
Box plot of Log10 peptide intensity of −UV peptides from S. cerevisiae PAR‐TRAPP (blue) samples (labelling as in (B)), plotted together with Log10 peptide intensity values imputed by imputeLCMD R package for −UV samples (orange).
Histogram of peptide intensity frequency obtained from −UV sample (1F), plotted for intensities from 0 to 5 × 10⁵ units. Colour labelling is as in (J).
Same analysis as panel (K), performed for sample 1R which had reversed SILAC labelling, compared to the sample analysed in panel (K).
Box plot of Log10 peptide intensity of −UV peptides from E. coli TRAPP (at 1,360 mJ cm−2) (blue) samples (labelling as in (C)), plotted together with Log10 peptide intensity values imputed by imputeLCMD R package for −UV samples (orange).
Histogram of peptide intensity frequency obtained from −UV sample (1F), plotted for intensities from 0 to 5 × 10⁵ units. Colour labelling is as in (M).
Same analysis as panel (N), performed for sample 1R which had reversed SILAC labelling, compared to the sample analysed in panel (N).

