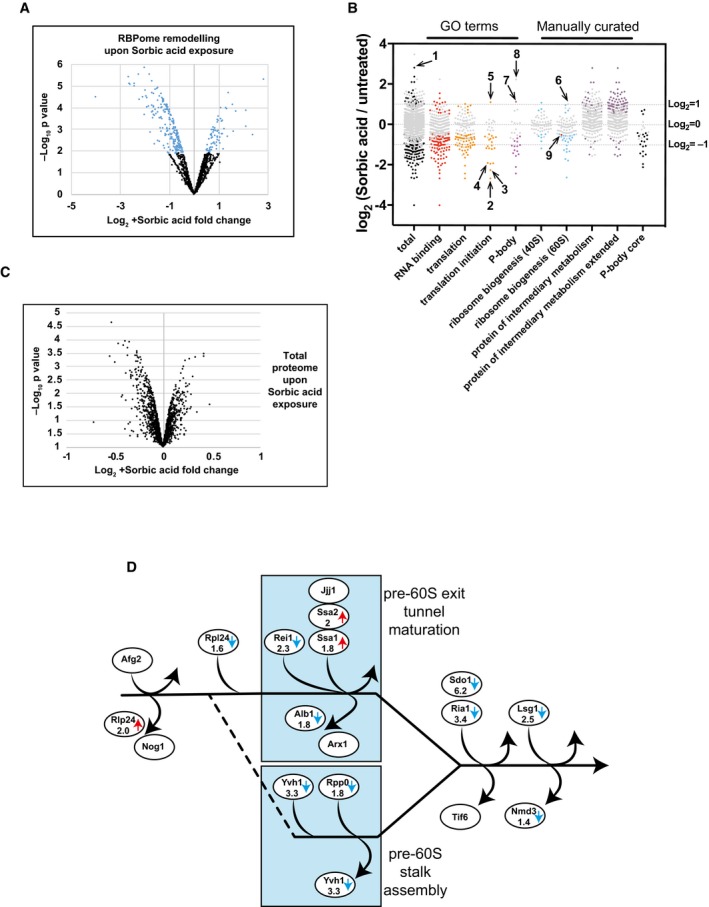
Scatter plot of Log
2 SILAC ratios +Sorbic/−Sorbic for
Saccharomyces cerevisiae proteins, quantified with PAR‐TRAPP. Grey points represent proteins showing no statistically significant change upon sorbic acid exposure in PAR‐TRAPP, while proteins changing significantly (
P‐value adjusted < 0.05) are labelled with other colours. Only proteins observed as RNA interacting in PAR‐TRAPP were included in the analysis, except for proteins in the category “protein of intermediary metabolism extended”, for which this criterion was dropped. Proteins annotated with GO term categories “RNA binding”, “translation”, “translation initiation”, “P‐body” and “small molecule metabolism” are displayed together with proteins annotated in literature‐curated lists: “ribosome biogenesis 40S”, “ribosome biogenesis 60S” (Woolford & Baserga,
2013). Proteins belonging to categories “protein of intermediary metabolism” and “protein of intermediary metabolism extended” are yeast enzymes and transporters of intermediary metabolism, obtained from YMDB and further filtered to remove aminoacyl‐tRNA synthetases. “P‐body core” category contains proteins identified as core components of P‐bodies in yeast (Buchan
et al,
2010). Numbers label the following protein on the chart: 1 – Rtc3; 2 – Tif3; 3 – Rpg1; 4 – Tif35; 5 – Gcd11; 6 – Rlp24; 7 – Ssd1; 8 – Rbp7; 9 – Nmd3.

