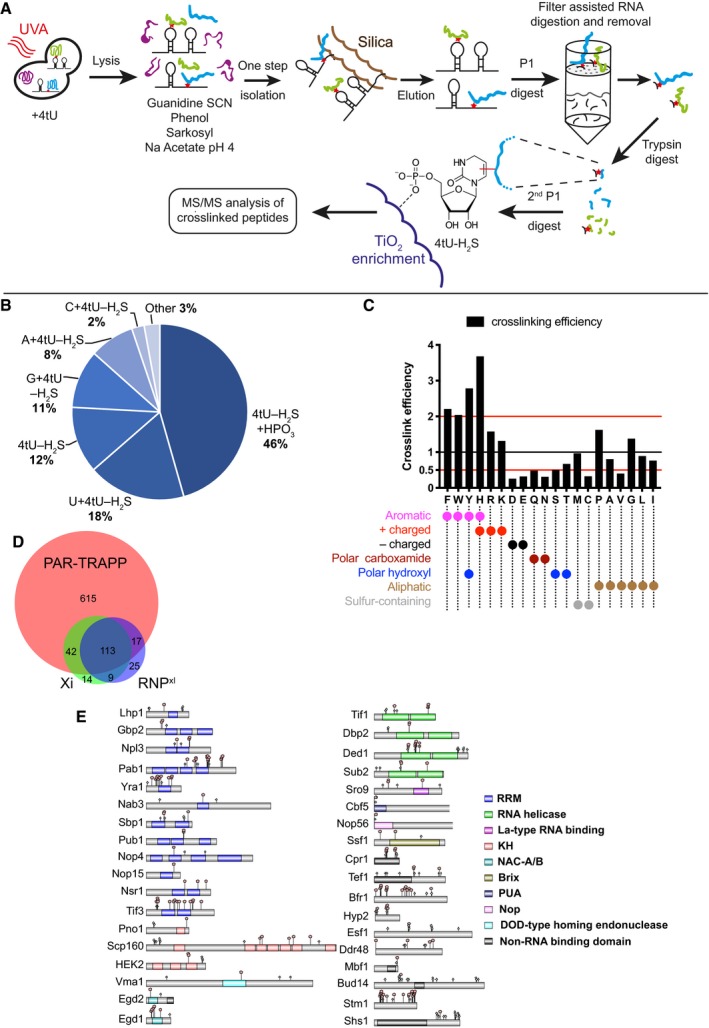
Figure 6. Identifying the RNA‐crosslinked peptides with iTRAPP.

- iTRAPP workflow to directly observe crosslinked RNA–peptides species by mass spectrometry. See the main text for details.
- Pie chart of RNA species observed crosslinked to peptides by the Xi search engine.
- The analysis of amino acids, reported as crosslinked by the Xi search engine. Amino acids are represented by single letter IUPAC codes. Black bars—crosslink efficiency, defined as ratio between the frequency of the crosslinked amino acid and the frequency of the amino acid in all crosslinked peptides.
- Venn diagram showing the overlap between proteins identified in PAR‐TRAPP, RNPxl and Xi. Protein groups, reported by RNPxl and Xi, were expanded to single proteins so as to maximize the resulting overlap.
- Domain structure of selected proteins, identified as crosslinked by the Xi search engine. Domains (coloured rectangles) and sites of phosphorylation (light green rhombi) from the UniProt database were plotted onto proteins represented by grey rectangles. Crosslink sites, identified by Xi, are indicated with red pentagons. See also Appendix Supplementary Methods.
