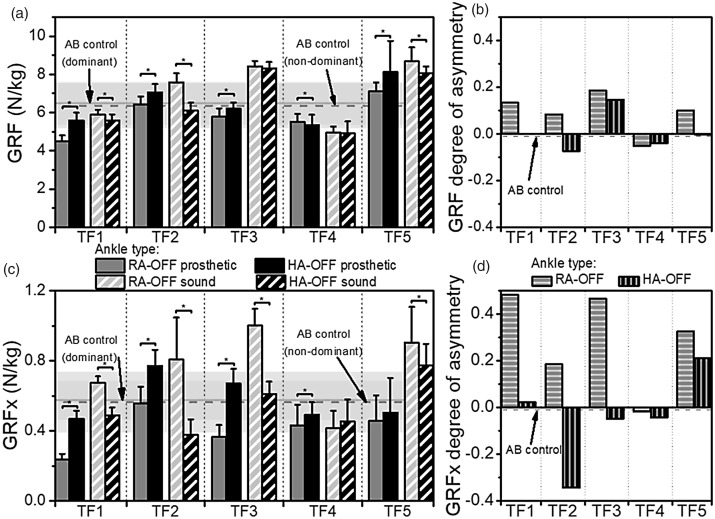
Figure 4.
The mean (a) ground reaction force (GRF) and (c) ground reaction force component parallel to the ground (GRFx) for each participantunder the prosthetic foot (solid) and the sound foot (striped) when using a rigid ankle-foot (grey) and a hydraulic ankle-foot (black). The error bars indicate ± one standard deviation. Values were measured with ‘standing support’ off. Significant changes are marked with asterisks. The background horizontal lines and shaded areas indicate the mean ± one standard deviation ranges for the GRF/GRFx of the dominant (solid line) and non-dominant (dashed line) limbs of the able-bodied (AB) control participants. Also shown are the degree-of-asymmetry values for (b) GRF and (d) GRFx, for each of the participants when using a rigid ankle-foot (horizontal stripes) and a hydraulic ankle-foot (vertical stripes).

