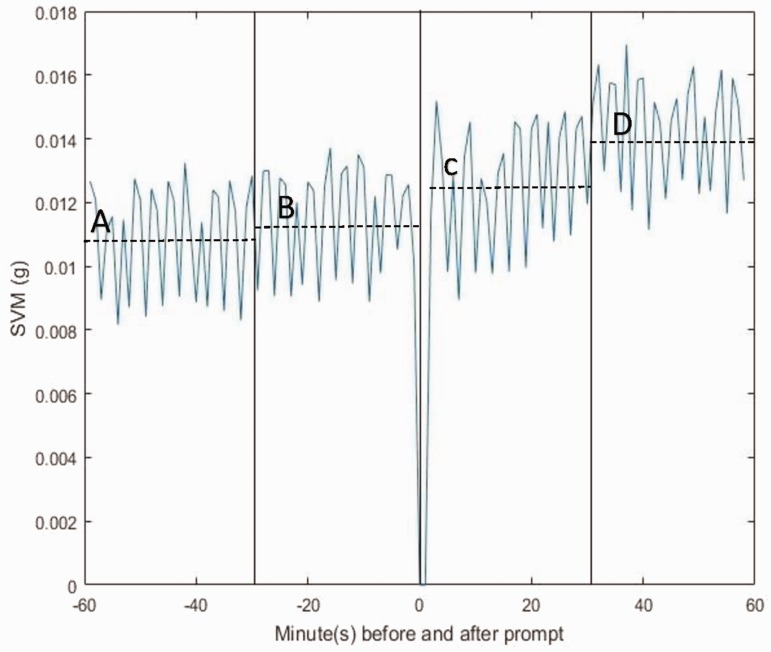
Figure 3.
Distribution of SVM in minutes before and after prompt. Vertical solid lines represent 30-min time intervals. Dashed horizontal lines reflect the mean SVM/minute for each time interval as follows: (A) mean SVM/min −60 to −30 min before a prompt = 0.0109, (B) mean SVM/min −30 to −1 min before a prompt = 0.0111, (C) mean SVM/min + 1 to + 30 min after a prompt = 0.0125 and (D) mean SVM/min + 31 to + 60 min after a prompt = 0.0109. Note that data ± 1 min of a prompt were not included in the analysis to avoid possible SVM contamination by the CueS motor vibration. SVM: signal vector magnitude.

