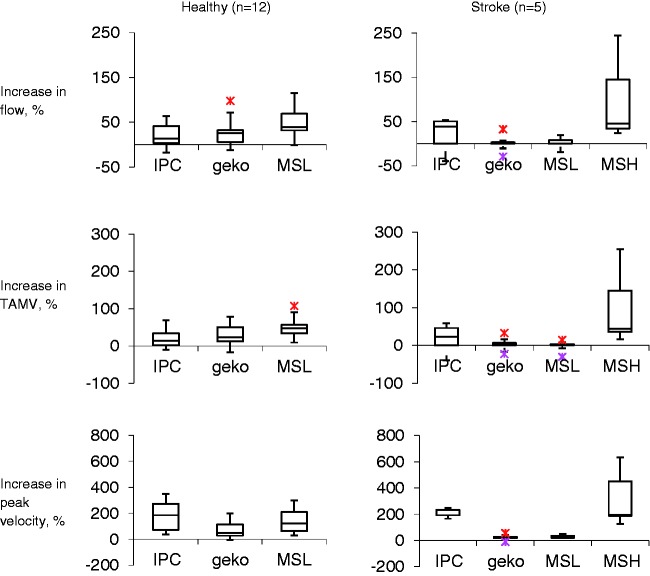
Figure 2.
Percentage increase in blood flow from baseline. The bottom of the box represents the 25th percentile, the centre of the box represents the median and the top of the box represents the 75th percentile. The vertical lines represent the extremes of values.
TAMV, time average mean velocity; MSL, Orthopaedic Microstim 2V2 low setting; MSH, Orthopaedic Microstim 2V2 high setting; IPC, intermittent pneumatic compression.

