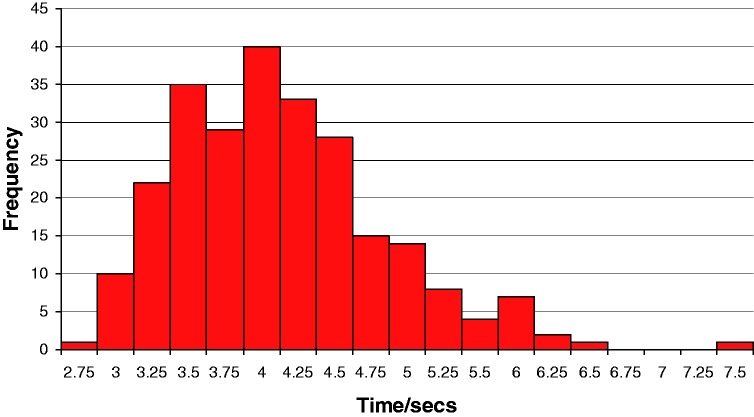
Figure 2.
Distribution of Down times for use of the CRT for 50 adult subjects using their dominant hand. Results are the mean of five runs. Similarly to the times to move the pins Up there is an upper limit for the times and longer distribution of the slower times. The Down times show a greater skew towards the faster times.

