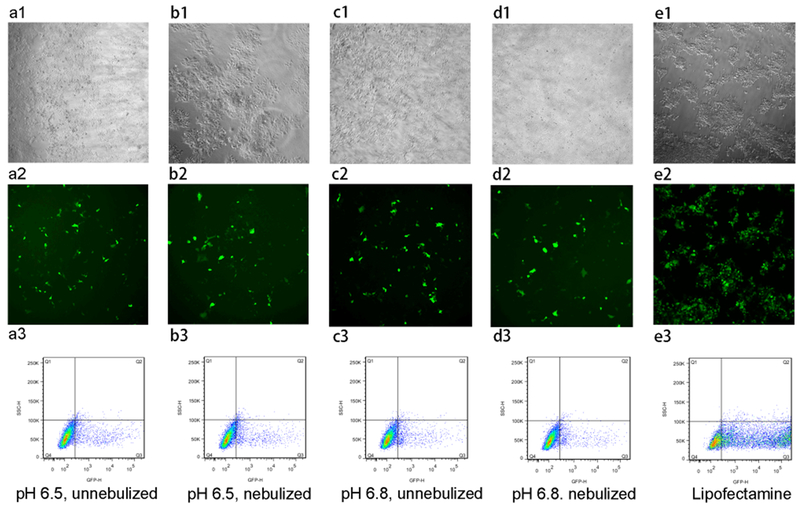
Figure 12.
Transfection efficiency of mPEG–OC/DNA nanocomplexes (N/P = 20) in HEK-293 cells. (a1–a3) HEK-293 cells transfected with mPEG–OC/DNA nanocomplexes without nebulization at pH = 6.5, (b1–b3) HEK-293 cells transfected with mPEG–OC/DNA nanocomplexes with nebulization at pH = 6.5, (c1–c3) HEK-293 cells transfected with mPEG–OC/DNA nanocomplexes without nebulization at pH = 6.8, (d1–d3) HEK-293 cells transfected with mPEG–OC/DNA nanocomplexes with nebulization at pH = 6.8, (e1–e3) HEK-293 cells transfected with lipofectamine 3000. (a1–e1) contrast phase images, (b1–e1) fluorescent images, and (c1–e1) flow cytometry dot-plot (SSC-H/GFP-H).

