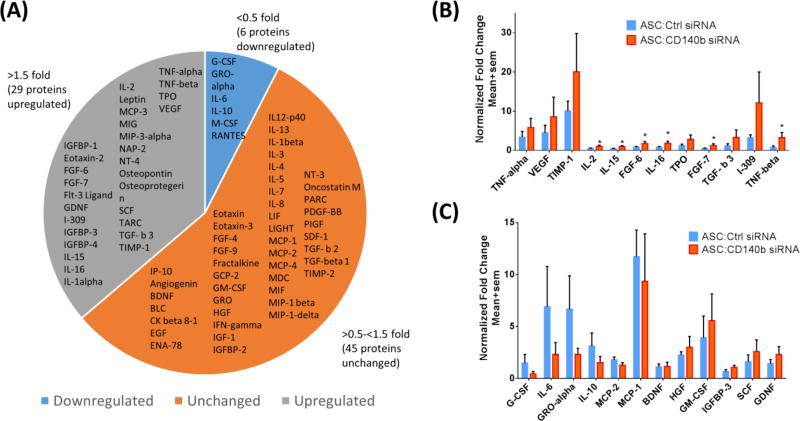
Figure 4. Knocking-down CD140b in ASCs altered expression profile of multiple human cytokines.
(A) Collective pie-chart of all assessed human cytokines in ASCs supernatant, showing up-regulation in 29 cytokines (>1.5 fold); down-regulation in 6 cytokines (<0.5 fold); and no change in 45 cytokines (0.5–1.5 fold) by knocking-down CD140b. (B) Bar graph of representative upregulated cytokines showing significant up-regulation in IL-2, IL-15, FGF-6, IL-16, FGF-7 and TNF-β. (C) Bar graph of the representative downregulated cytokines. Data represent Mean ± SEM performed in duplicates. *, p<0.05; n=8 donors.

