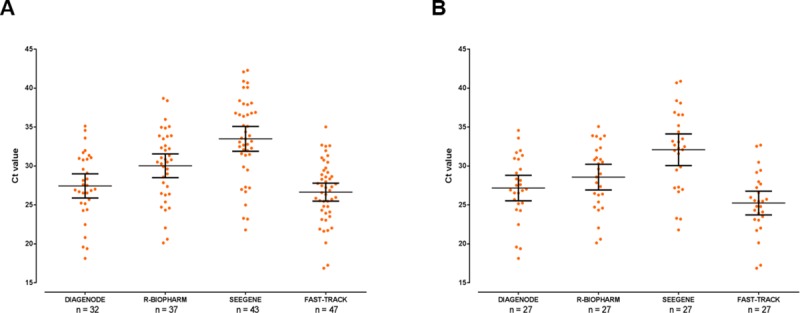
Fig 2. Dotplot showing the distribution of Ct values for G. duodenalis-positive DNA samples obtained with each of the four commercial multiplex real-time PCR assays evaluated in this study.

Mean values and standard deviation ranges for each group are represented by large and short horizontal bars, respectively. Unpaired (panel A) and paired (panel B) groups were represented for comparative purposes.
