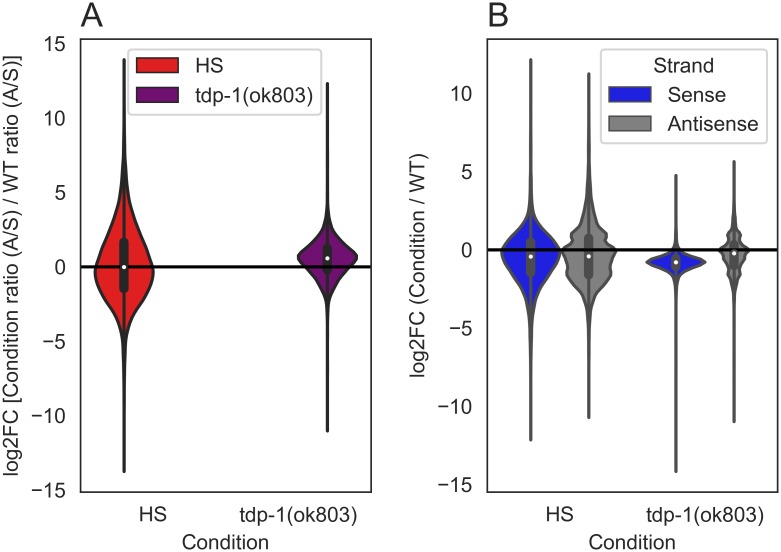
Fig 2. Quantification of genes with changes in antisense/sense ratios after heat shock or deletion of tdp-1 in input RNA.
Violin plots of the ratio of read counts over gene regions for each condition compared to wild type (WT) [mean >20 for pooled counts (sense and antisense, condition and wild type), n = 1]. (A) With heat shock 5513/11091 genes have a higher antisense/sense ratio compared to wild type (log2FC > 0, area of red violin plot above the black line). With tdp-1(ok803) 7551/10831 genes have a higher antisense/sense ratio compared to wild type (log2FC > 0, area of purple violin plot above the black line). (B) With heat shock, 4125/11091 sense and 3679/11091 antisense transcripts are upregulated compared to wild type (log2FC > 0, area of violin plot above the black line). With tdp-1(ok803) 419/10831 sense and 3301/10831 antisense transcripts are upregulated compared to wild type.

