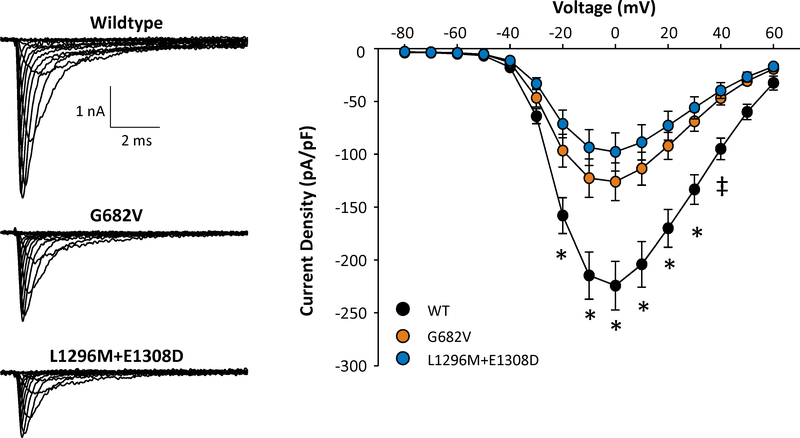
Figure 3.
Functional evaluation of SCN1A variants.
A. Representative whole-cell sodium currents recorded from tsA201 cells expressing either WT NaV1.1 or SIDS associated variants. B. Current-voltage relationships of WT NaV1.1 and SIDS associated variants. All data are expressed as mean ± SEM for 14–15 measurements. Statistical differences were determined by ANOVA (*, p<0.05 for both variants compared to WT; ‡, p<0.05 between WT and L1296M / E1308D).

