. 2019 Apr 8;8:e40145. doi: 10.7554/eLife.40145

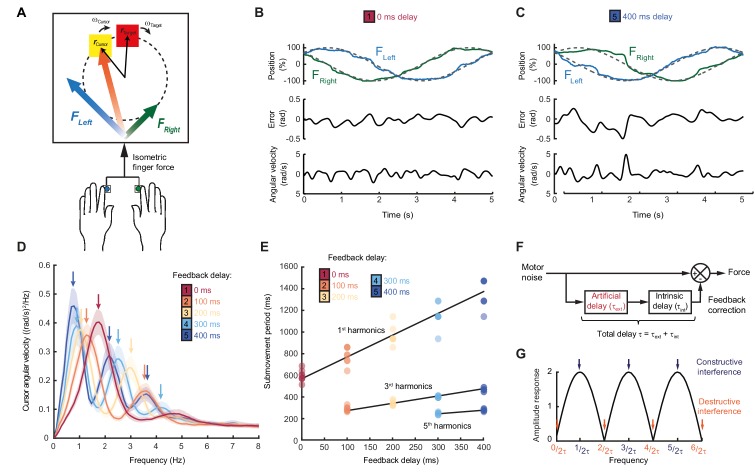
Figure 1. Movement intermittency during visuomotor tracking depends on feedback delays.

(A) Schematic of human tracking task. Bimanual isometric finger forces controlled 2D cursor position to track slow, circular target motion. Kinematic analyses used the angular velocity of the cursor subtended at the screen center during the middle of each trial. (B) Example force (top), angular error (middle) and cursor angular velocity (bottom) traces during target tracking with no feedback delay. Submovements are evident as intermittent fluctuations in angular velocity. (C) Example movement traces with 400 ms feedback delay. (D) Power spectra of cursor angular velocity with different feedback delays between 0 and 400 ms. Analysis based on a 10 s window beginning 5 s after trial start. Average of 8 subjects, shading indicates standard error of mean (s.e.m.). See also Figure 1—figure supplement 2. (E) Submovement periods (reciprocal of the peak frequency for each harmonic) for all subjects with different feedback delays. Lines indicate linear regression over all subjects. See Table 1 for summary of individual subject regression analysis. (F) Schematic of a simple delayed feedback controller. (G) Amplitude response of the system shown in (F), known as a comb filter.

Figure 1—source data 1. Subject information, time periods of submovement peaks and associated regression analysis.
Data for individual subjects in Experiment 1 (summarized in Figure 1E and Table 1).
DOI: 10.7554/eLife.40145.006

Figure 1.

Figure 1—figure supplement 1. Effect of target speed on movement intermittency.
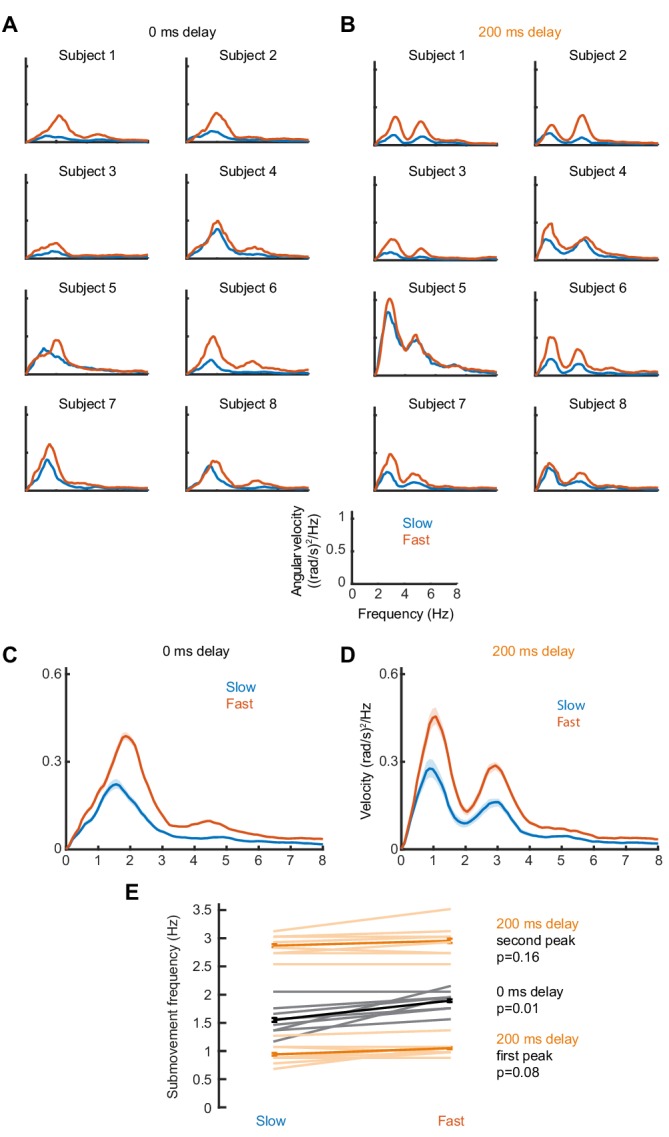
Figure 1—figure supplement 1.

(A) Power spectra of cursor angular velocity for individual subjects with slow (0.1 cycles/s) or fast (0.2 cycles/s) target rotation, and no feedback delay. (B) Power spectra of cursor angular velocity with slow or fast target rotation, and 200 ms feedback delay. (C,D) Average power, showing mean ± s.e.m. for eight subjects. (E) Average ± s.e.m. frequencies of peak cursor velocity in each condition. P values calculated using a paired t-test.
Figure 1—figure supplement 2. Individual subject power spectra of cursor velocity with different feedback delays.
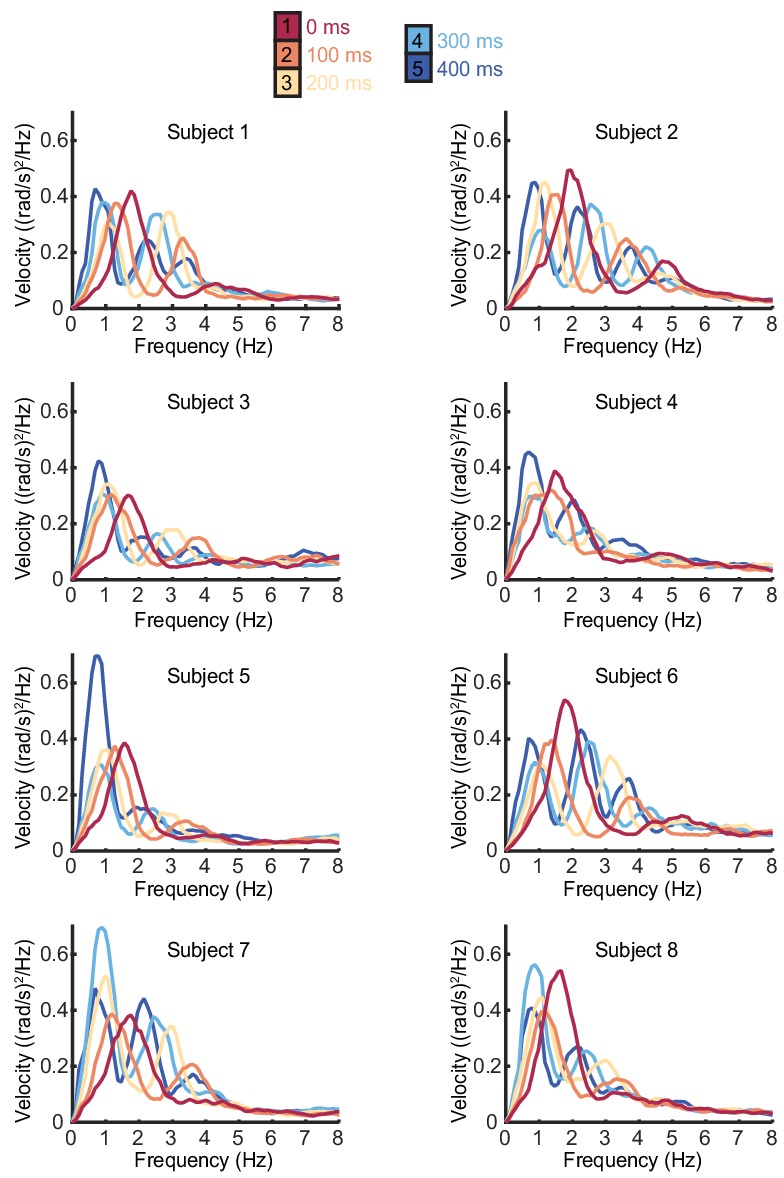
Figure 1—figure supplement 2.

Power spectra of cursor angular velocity for individual subjects with 0–400 ms feedback delay. The average over subjects is shown in Figure 1D.
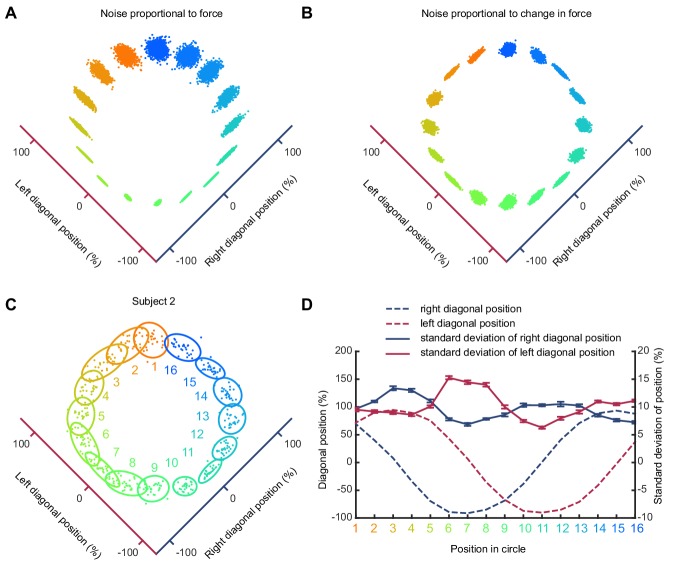
Figure 1—figure supplement 3. Trajectory variability depends on change in isometric force.

Figure 1—figure supplement 3.

(A) Simulated pattern of trial-to-trial variability if motor noise is proportional to absolute force. (B) Simulated pattern of trial-to-trial variability if motor noise is proportional to derivative of force. (C) Variability of a typical subject during counter clockwise tracking. 2D cursor position over multiple trials and associated covariance ellipses are shown for 16 target positions. (D) Average and s.e.m. of standard deviation of force along each finger axis for the 16 target positions. Note that variability is maximal at times of maximal change in associated finger force (dashed lines).