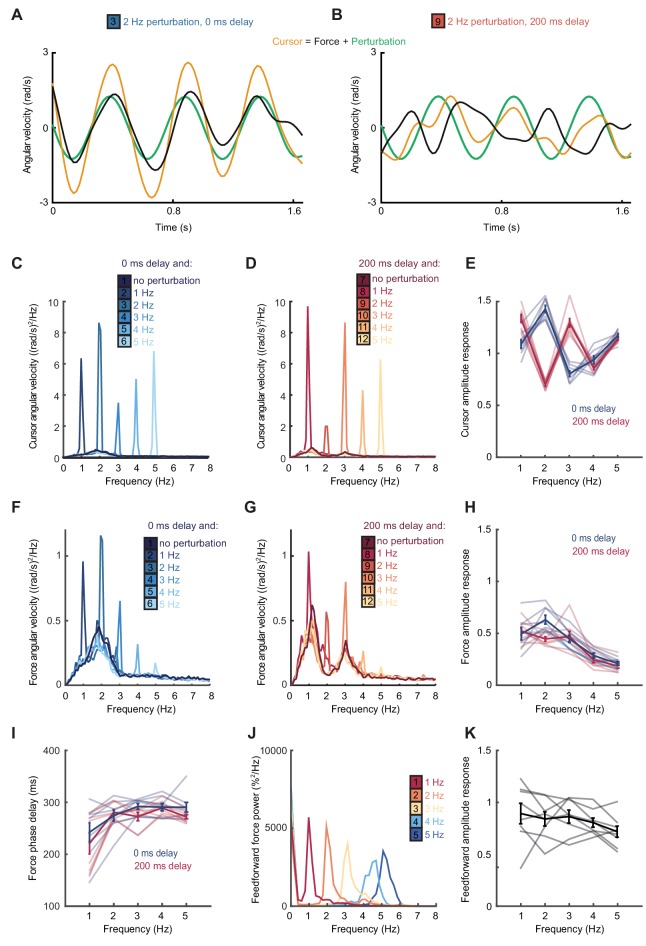
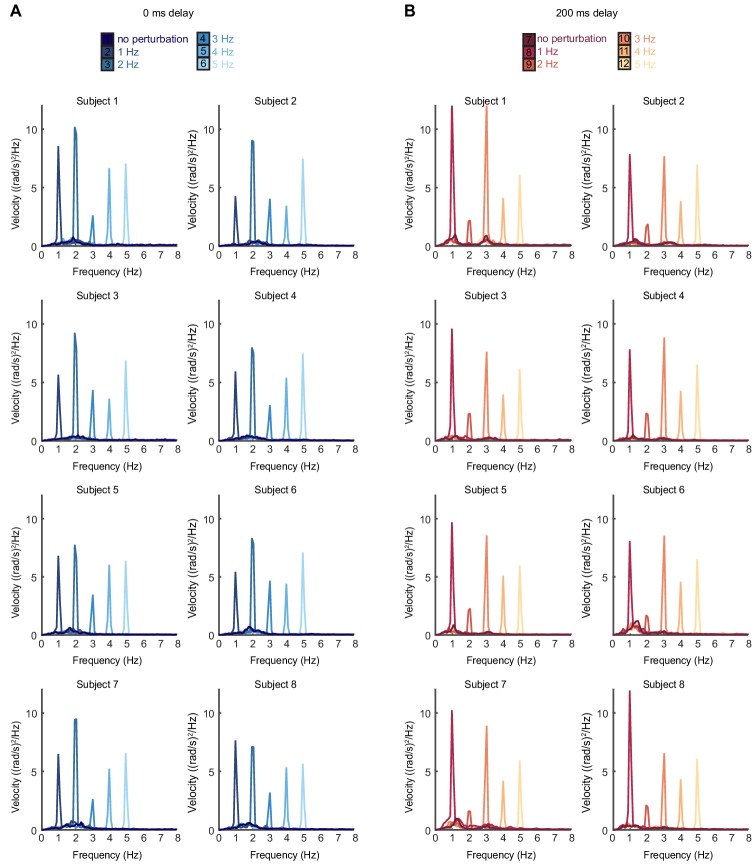
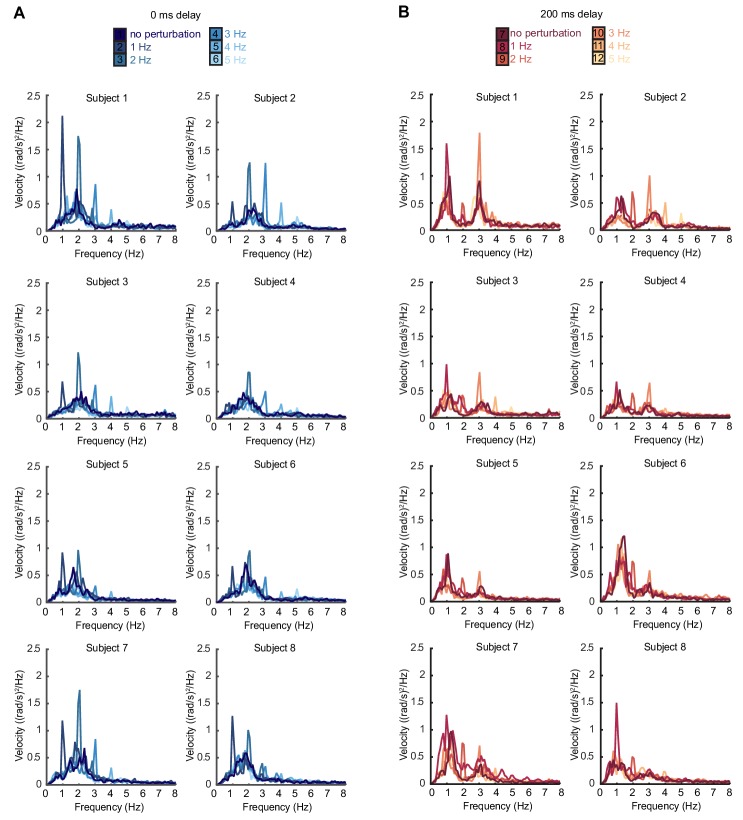
Figure 2. Frequency responses and phase delays to artificial motor errors.
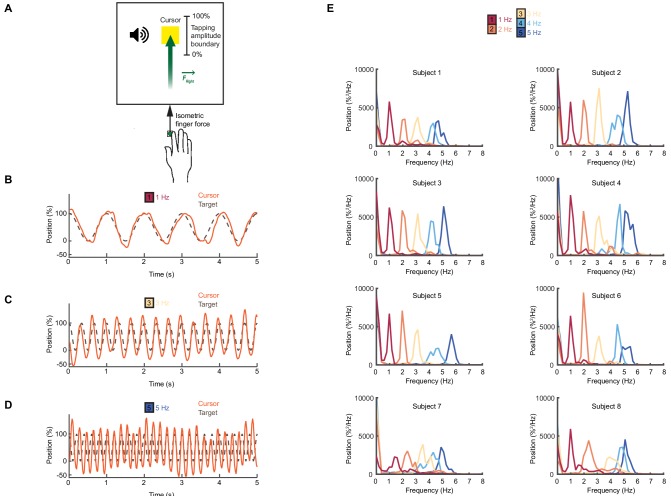
(A) Example force (black) and cursor (yellow) angular velocity traces in the presence of a 2 Hz perturbation (green) when no feedback delay was added. The force response and perturbation sum to produce large fluctuations in cursor velocity. (B) Comparable data with a feedback delay of 200 ms. In this condition, force responses cancel the perturbation leading to an attenuation of intermittency. (C) Power spectra of cursor angular velocity with 1–5 Hz perturbations and no feedback delay. Analysis based on 10 s windows beginning 5 s after trial start. Average of 8 subjects. See also Figure 2—figure supplement 1. (D) Power spectra of cursor angular velocity with 1–5 Hz perturbations and 200 ms feedback delay. (E) Cursor amplitude response to 1–5 Hz perturbations with no feedback delay (blue) and 200 ms feedback delay (red) for individual subjects. Also shown is the average ± s.e.m. of 8 subjects. (F) Power spectra of force angular velocity with 1–5 Hz perturbations and no feedback delay. See also Figure 2—figure supplement 2. (G) Power spectra of force angular velocity with 1–5 Hz perturbations and 200 ms feedback delay. (H) Force amplitude response to 1–5 Hz perturbations with no feedback delay (blue) and 200 ms feedback delay (red). Also shown is average ± s.e.m. of 8 subjects. (I) Intrinsic phase delay of force response to 1–5 Hz perturbations with no feedback delay (blue) and 200 ms feedback delay (red). Also shown is average ± s.e.m. of 8 subjects. (J) Power spectrum of finger forces generated in the feedforward task with auditory cues at 15 Hz. Average of 8 subjects. See also Figure 2—figure supplement 3. (K) Force amplitude response to auditory cues in the feedforward task. Also shown is average ± s.e.m. of 8 subjects. All analyses based on a 10 s windows beginning 5 s after trial start.


