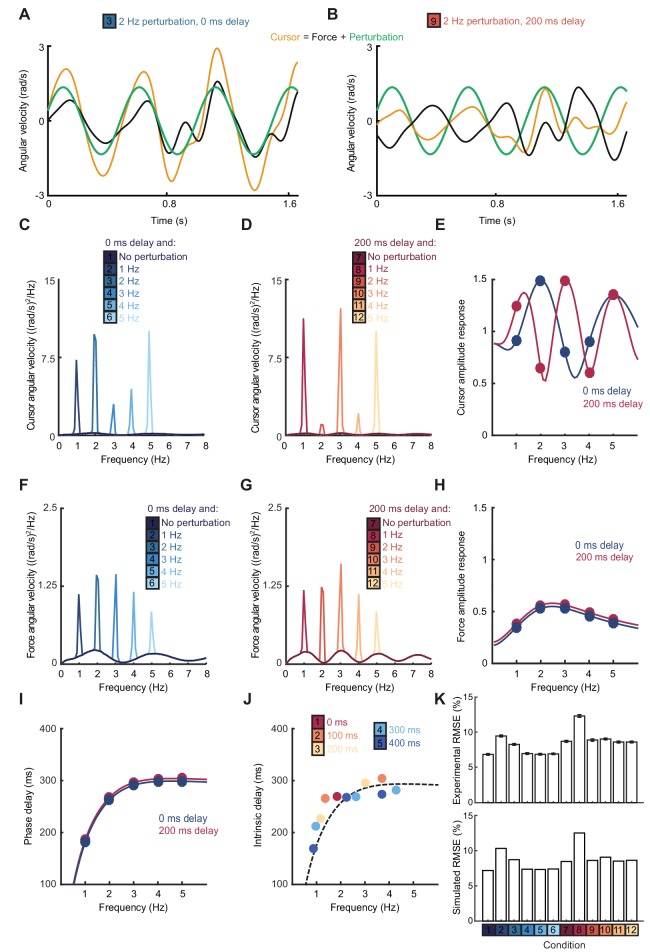
Figure 4. Smith Predictor model with optimal state estimation reproduces human behavioral data.
(A) Simulated tracking performance of the model with a 2 Hz sinusoidal perturbation and no feedback delay. (B) Simulated tracking performance of the model with a 2 Hz sinusoidal perturbation and 200 ms feedback delay. (C) Power spectrum of simulated cursor velocity with 1–5 Hz perturbations and no feedback delay. (D) Power spectrum of simulated cursor velocity with 1–5 Hz perturbations and 200 ms feedback delay. (E) Simulated cursor amplitude response to 1–5 Hz perturbations with no feedback delay (blue) and 200 ms feedback delay (red). (F) Power spectrum of simulated force velocity with 1–5 Hz perturbations and no feedback delay. (G) Power spectrum of simulated force velocity with 1–5 Hz perturbations and 200 ms feedback delay. (H) Simulated force amplitude response to 1–5 Hz perturbations with no feedback delay (blue) and 200 ms feedback delay (red). (I) Simulated intrinsic phase delay of force responses to 1–5 Hz perturbations with no feedback delay (blue) and 200 ms feedback delay (red). (J) Intrinsic delay times corresponding to all submovement peaks/harmonics in Figure 1D, plotted against the frequency of the peak. Dashed line indicates phase delay of the simulated optimal controller (K) Top: Positional inaccuracy of human tracking for all conditions quantified as root mean squared error (RMSE). Average ± s.e.m. of 8 subjects. Bottom: RMSE of simulated tracking for all conditions.

