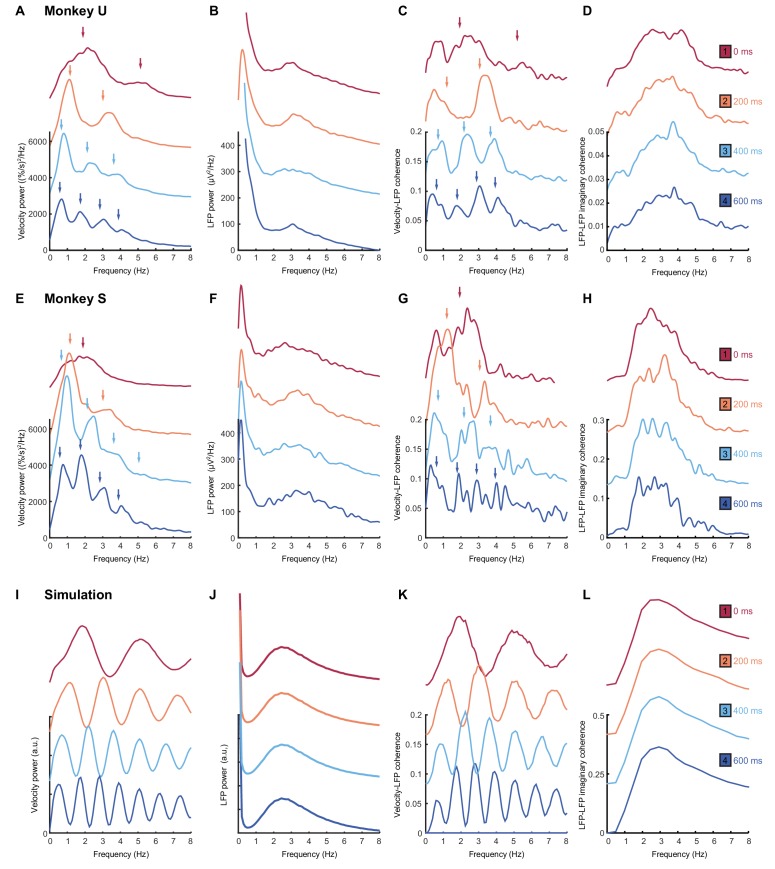
Figure 7. Frequency-domain analysis reveals delay-dependent and delay-independent spectral features.
(A) Power spectrum of radial cursor speed with 0–600 ms feedback delay. Traces have been off-set for clarity. Arrows indicate expected frequencies of peaks from OFC model. Data from Monkey U. (B) Average power spectrum of M1 LFPs. (C) Average coherence spectrum between radial cursor speed and all M1 LFPs. (D) Average imaginary coherence spectrum between all pairs of M1 LFPs. (E–H) As above, but for Monkey S. (I–L) Simulated power and coherence spectra produced by the OFC model.

